Ventura County Home Sales: Did You Think We Were Out of the Woods?
The pandemic is still underway, but things are easing up.
It was still a full lock down during May 2020, and it clearly shows in the home sales data. April was the start of the data being skewed downward, and May’s sales showed the carnage of the shelter-in-place.
We sure felt it.
But things are looking up.
Now that June is here, people are venturing outside more. They’re even braving crowds. We’re transforming out of the extremely rigid, mask-wearing, and fear-of-touching real estate market.
Maybe we’re more adapted to the new restrictions. Seeing a house now is not unlike going shopping at the supermarket. Same safety protocols. It’s not as scary as it first was back in late February and early March.
You Have to Look Back 30-45 Days
In terms of evaluating the condition of the market, we’re looking at the actual calendar month of May 2020. But there is more to consider beyond this data.
For home buyers, the process started earlier than that. We need to look back 30-45 days to account for the time from when somebody fell in love with a house and wrote an offer, opened escrow, journeyed through the escrow process, and finally closed with keys in hand.
We’re not computing it into the data itself, but we need to be aware of the atmosphere and sentiment during the earlier time and the impact it may have had on home buying and selling activity.
Here is what happened in May:
A Bird’s Eye Perspective: It’s not just local, only in Ventura County. On a regional level, the California Association of REALTORS® has a report on the entire state as well as for the Southern California region. WATCH THE VIDEOS
- You Have to Look Back 30-45 Days
- Real Estate Market Trends: Ups and Downs
- Real Estate Market Data: Days on Market, Sales Price, Pending Sales, Average Price- May’s Home Sales
- It’s Chart Time!
- Real Estate Market Statistics: How’s Your Zip?
- Absorption Rate and Months of Supply Housing: The Barometer for Our Time
- What Buyers Need to Know
- What Sellers Need to Know
- A Guide on Shopping For Homes During A Pandemic
- San Fernando Valley & Santa Clarita Valley: Similar Picture to Ventura County
- Wrap Up and My Two Cents
Real Estate Market Trends: Ups and Downs
If you want to see how things have changed since April, just take a look at last month’s report. May 2020 Report (It shows April’s sales.)
Real Estate Market Data: Days on Market, Sales Price, Pending Sales, Average Price- May’s Home Sales
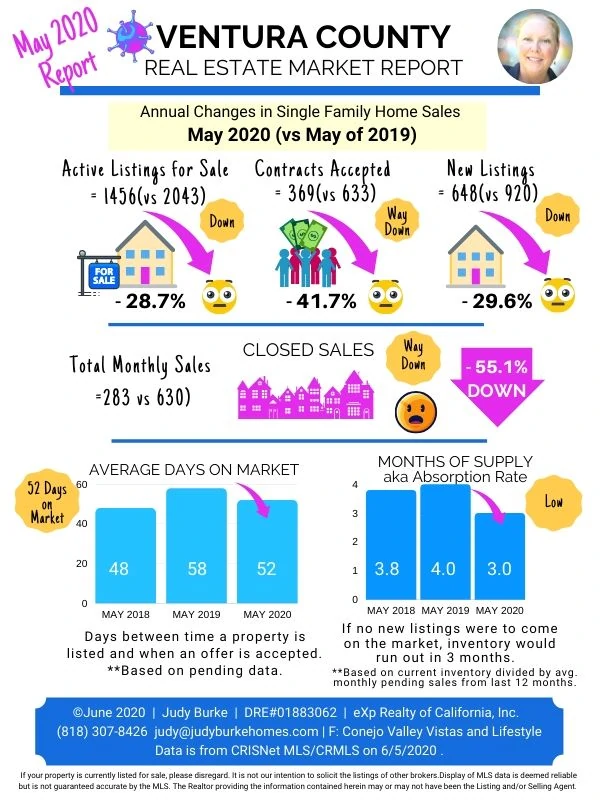
Here’s a summary of May 2020 home sales market statistics:
- Median home sales price:
- UP 2.9% YOY
- May 2020 = $679,000 vs May 2019 = $660,000
- Prices are holding up
- Average single family home sales price:
- UP 4.0% YOY
- May 2020 = $804,991 vs May 2019 = $774,362
- Prices are holding up
- New listings:
- DOWN 29.6% YOY
- May 2020 = 648 vs May 2019 = 920
- April 2020 had 469 new listings, so they were up month-over-month (MOM)
- Active listings:
- DOWN 28.7% YOY
- May 2020 = 1456 vs May 2019 = 2043
- April 2020 had only 1350. Increasing.
- Pending sales:
- DOWN 41.7 % YOY
- May 2020 = 369 vs May 2019 = 633
- That’s half the volume of May last year.
- April 2020 had 309. Beginning to increase month to month.
- Closed sales:
- DOWN 55.1% YOY
- May 2020 = 283 vs May 2019 = 630
- This is the most important category. What actually closed escrow.
- April 2020 had 386. Fewer than in April.
Active listings in the context of this report represents all homes that are in the process of being sold. This category encompasses the MLS categories of Active, Active Under Contract, and Pending. In other words, they are at any stage of “for sale”, but have not sold yet.
It’s Chart Time!
Click on the charts below for a separate pop-up window. You’ll get a interactive graph that shows precise numbers for each calendar month. I’m including the two most dramatic charts.
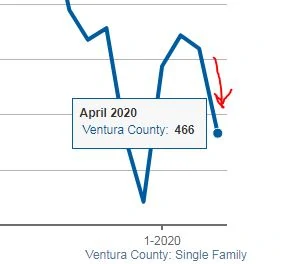
New Listings in April 2020: Very Few New Listings
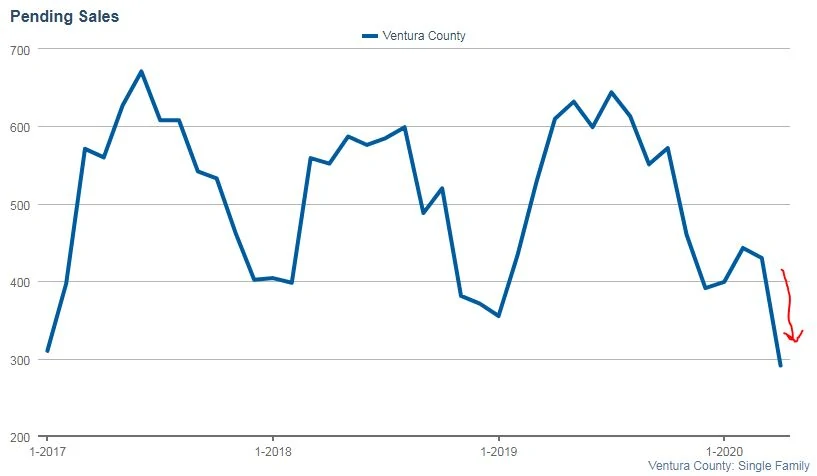
Pending Sales in April 2020: Escrows Falling Off A Cliff
Real Estate Market Statistics: How’s Your Zip?
This shows how specific zip codes compared to each other.
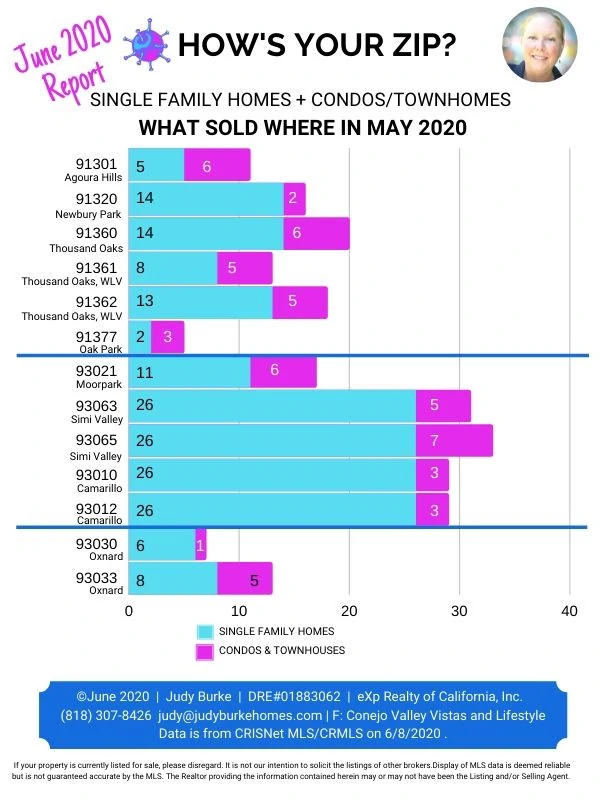
Overall, the above zip code sales were historically LOW!
For individual zip code SFR sales, Camarillo’s 93012 felt the least pain at -13.4% YOY.
The hardest hit was a toss between Agoura Hills 91301 at -82.1 % YOY and Oak Park at -83.3% YOY.
Oxnard’s 93033 was also low at -56.5% YOY.
Fortunately, New Listings rose, thus giving buyers more choices. As long as buying interest remains, the number of closed sales should rise in next month’s report.
Absorption Rate and Months of Supply Housing: The Barometer for Our Time
Absorption Rate or Months of Supply shows how long it would take to sell the existing inventory if no new homes came on the market.
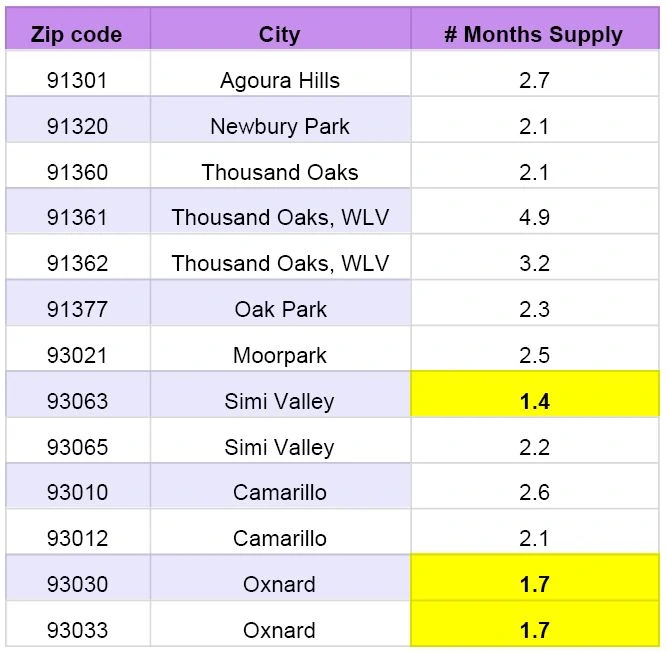
Take a look at everything highlighted in yellow. Although Ventura County inventory would run out in 2.6 months, some zips are under 2 month’s supply.
Absorption Rate is calculated based on current inventory divided by the average monthly pending sales from the last 12 months.
What Buyers Need to Know
Things are beginning to change.
Although May was low, it wasn’t as bad as April, in terms of new inventory.
Now that we’re in June, the increase upward continues, and this month is only partly done. That’s good news if you’re shopping for a home.
Be prepared to be scrutinized by your lender. They’re gravitating towards safety and exercising caution, just like last month. Due to the unemployment rate, you should expect that they’ll make a call to your employer before funding. They’ll verify that you’re still working and still have a job as your purchase moves its way through escrow.
Be patient and flexible.
What Sellers Need to Know
This is still a seller’s market.
As inventory increases, remember to price your home competitively, in line with the market. A low supply of active listings and low months of inventory means less competition and is likely good news to your ears. The house still has to be appraised by the lender, so wacky values don’t necessarily close.
Buyers are picky so make sure your home is in the best possible condition. Due to the lock down, photos are more crucial than ever. It’s typically a requirement right now for buyers to view the photos online (who doesn’t anyway?). We’re seeing more 360 tours and videos, although most buyers still want to see the house in person before deciding.
Stay positive. It’s getting better.
A Guide on Shopping For Homes During A Pandemic
People are still buying, sellers are selling, sales are closing. Showing rules are the new adjustment we all have to make to stay safe. Here are some things you need to be aware of as you start your home buying and selling process. These are the rules for right now.
- No open houses permitted. VIRTUAL OPEN HOUSES only.
- Virtual tours and 3-D photos preferred and viewing photos is a prerequisite to showings.
- Masks, gloves, hand washing/gel. Posted warning at door is now required.
- Same as last month: Mandatory signed disclosures to enter the property: EVERYONE.
- Same as last month: Sellers not home during showings in order to prevent virus spread.
- Same as last month: Number of buyers at showings limited. Don’t bring a friend.
- Same as last month: Serious buyers only (Lender pre-approval and proof of funds needed. No looky loos). Be sure to get pre-approved in advance.
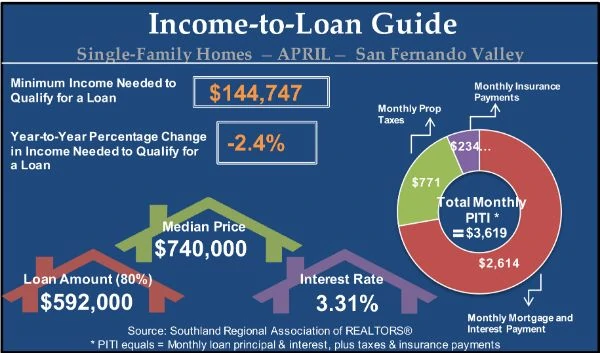
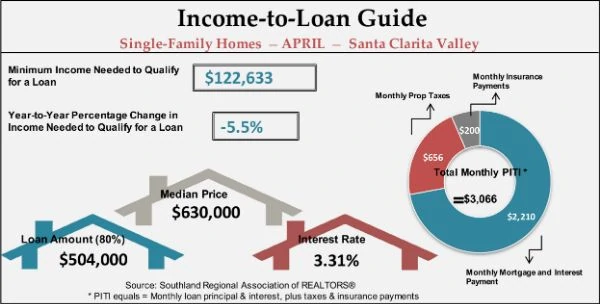
San Fernando Valley & Santa Clarita Valley: Similar Picture to Ventura County
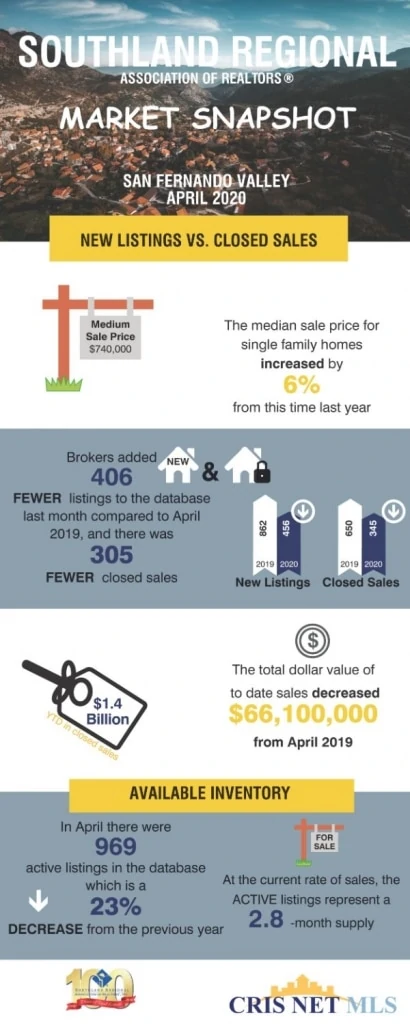
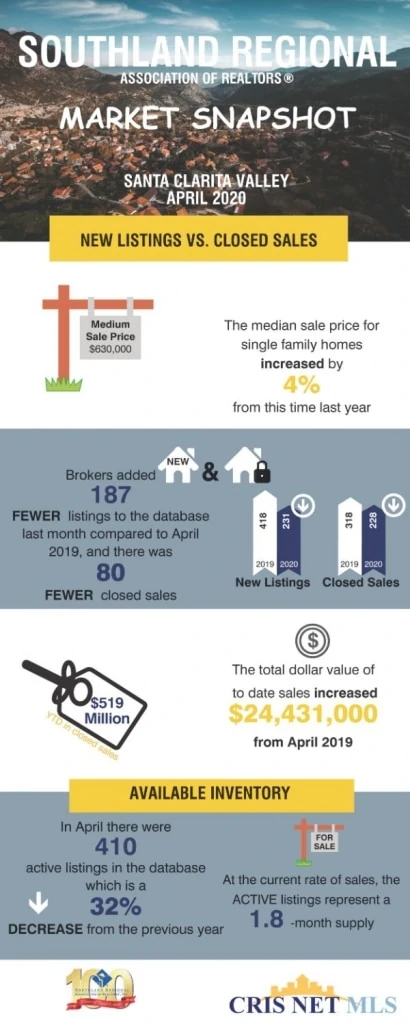
Both of our nearby valleys are also experiencing a low inventory.
Mortgage Income Requirements
Wrap Up and My Two Cents
We’re in uncharted territory with this virus, and each month brings something different. With supply continuing to be low, prices continue to hold or increase.
Note to sellers: It’s a good time to get your house ready to sell while you’re sheltering-in-place. You need the sunshine anyway! Photos will matter, so make sure your home is in the best possible visual shape. Videos and 3D tours show everything.
Every week seems to hold its own new drama, so don’t let the news mess with your head. Think with your analytical brain and be sure that facts figure into your decision making, especially during these trying times.
If I can be of help or if you need any additional information, contact me directly.
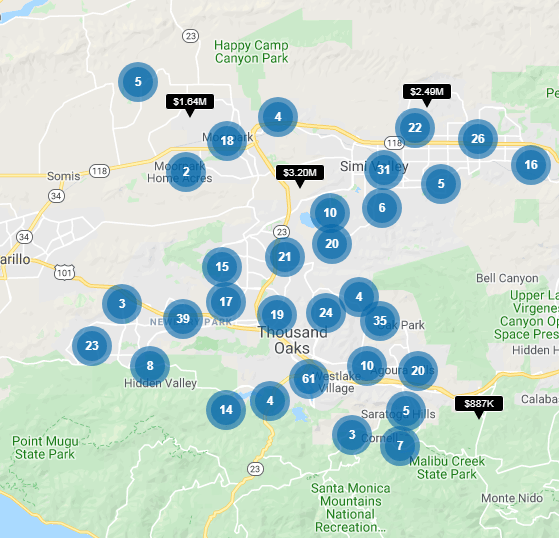
See all available homes
for sale in
Ventura County & the Greater Conejo
Disclaimer
Based on data obtained from CRMLS/CRISNet MLS (Southland Regional Association of Realtors) and Infosparks on 638/2020 and 6/8/2020.
If your property is currently listed for sale, please disregard. It is not our intention to solicit the listings of other brokers.Display of MLS data is deemed reliable but is not guaranteed accurate by the MLS. The Realtor providing the information contained herein may or may not have been the Listing and/or Selling Agent.
Courtesy of Judy Burke | DRE#01883062 | eXp Realty

