Ventura County Home Sales During March 2020 In The Age of Covid-19
Ventura County homes sales are different in a pandemic. New virus, new market, new procedures. It requires an adjustment.
As far as number of new listings and number of sales, under normal circumstances, the spring months bring increased activity. Then inventory builds until July or August, and finally declines until the end of the year.
Was It Different for March?
Governor Newsom issued a stay-at-home order on March 19, right in the middle of the month being evaluated. So we wouldn’t expect March sales data to be normal.
If you’ve noticed the streets lately, with a mandatory shutdown in our state, it makes sense that home sales are also feeling the clamp down.
SOLDS: In spite of the stay-at-home order, true to form this time of year, March 2020 Ventura County home sales were up 3.1% compared to March 2019. That’s 472 vs 458 single family houses sold. And compared to the previous month, they were up from 381 closed sales in February 2020.
Keep in mind that there is a 30-45 day look back window. If a property closes in March, you have to dial back in to mid-January or February for when the escrow likely opened.
We were just starting to see infections in Ventura County and nearby Los Angeles County in January and February. We didn’t have social distancing restrictions yet.
So although the number of completed home sales was not much different from last year at this time, the new listings, active, pending sales, and months of supply were affected.
You can’t tell people to shelter at home and not have this restriction affect decision making, marketing, and viewings.
This is a period of ADJUSTMENT.
Remember seeing masks in the supermarket for the first time?
Remember hearing about alcohol, bleach, and hand sanitizer?
Remember getting used to a 6-10 foot social distancing space?
It was a bit shocking at first. Now we’re used to it.
You’ll be using the same procedures in going to see houses.

- Was It Different for March?
- This is a period of ADJUSTMENT.
- Real Estate Market Trends: The Coronavirus Impact
- Real Estate Market Data: Days on Market, Sales Price, Pending Sales, Average Price
- It’s Chart Time!
- Real Estate Market Statistics: Ventura County Zip Code Level
- Absorption Rate and Low Supply
- What Buyers Need to Know
- What Sellers Need to Know
- A Peek at the Nearby Valleys
- Wrap Up and My Two Cents
Real Estate Market Trends: The Coronavirus Impact
Here’s what we’re seeing out there.
It’s still hard to find properties, with continuing low inventory, and then showings got more restrictive midway through March.
In case you want to see what things were like last month (February sales data), here’s the report. March 2020 Report
Safe Showings with Social Distancing: How We Do It Now
If you’re a buyer, you have been feeling the pain of nothing to choose from for quite a while. Now it’s a market that is safety-focused above all else.
- No open houses allowed. VIRTUAL OPEN HOUSES are the new rage.
- Virtual tours and 3D photos are preferred and a prerequisite to showings.
- Masks, gloves, booties for anybody entering the listing.
- Mandatory signed disclosures in order to enter the property: EVERYONE.
- And you sign the disclosures every time, for every single visit.
- Sellers can’t be home during the showings. This is to prevent virus spread.
- Buyer’s agent plus 2 buyers at the showing (must be from same household) at one time. Don’t bring a friend.
- Buyer must have a pre-approval from a lender and proof of funds (no looky loos).
Real Estate Market Data: Days on Market, Sales Price, Pending Sales, Average Price
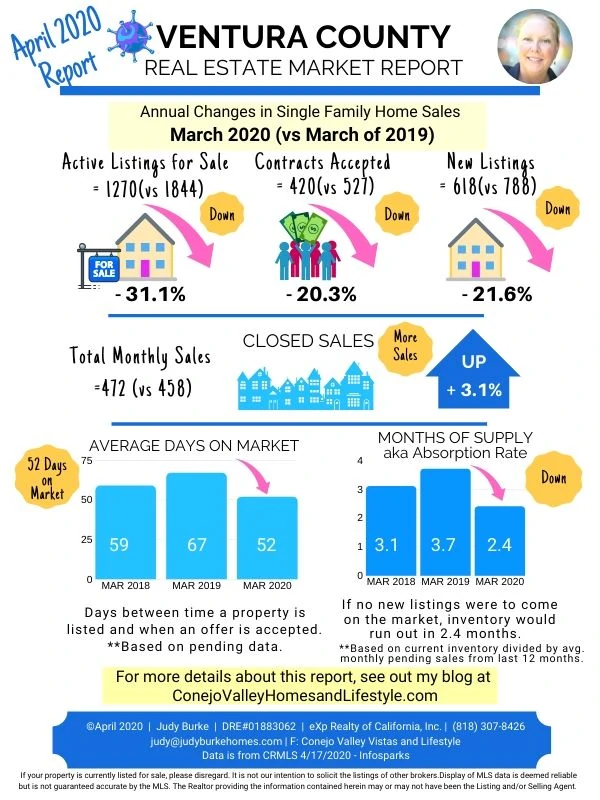
Here’s a summary:
- Median home sales price: UP. The median home sales price: $650,0000, up 9.4% from March 2019.
- Average single family home sales price: UP. $851,745, up 11% from March 2019.
- New listings: DOWN. This means FEWER choices. Newly listed single family homes 618, DOWN 21.6% from last year. In February there were 641 new listings. We don’t usually see a decrease this time of year. It just got harder to find a house, at least compared to last year.
- Active listings: DOWN. 1270 single family homes, which is also down from February’s 1327 active SFR listings.
- Pending listings: DOWN. Did escrows suffer? There were 420 pendings for the month, down 20.3% from a year ago. That’s what a virus will do.
- Closed listings: UP. This is the most important category. What actually closed escrow. There were 472 closed sales (vs 458 in March 2019). That’s still up from last month (381).
People are still buying, sellers are selling, sales are closing. Showing rules are the new adjustment we all have to make to stay safe.
Active listings in the context of this report represents all homes that are in the process of being sold. This category encompasses the MLS categories of Active, Active Under Contract, and Pending. In other words, they are at any stage of “for sale”, but have not sold yet.
It’s Chart Time!
These are interactive charts that you can hover over to see the previous month’s numbers.
New Listings: Down 21.6% from March 2019
There were over 800 new listings in March 2018 and close to that in 2019. There was a drop.
If you can’t see the chart, go here. New Listings
Active Listings: Down 31.1% from March 2019
And to think we had over 1600 in March of 2018! Supply in March was tight.
If you can’t see the chart, go here. Active Listings
Pending Sales: Down 20.3% from March 2019
Fewer escrows and stricter lending standards. Be aware that the lender checks buyer employment right up to funding.
If you can’t see the chart, go here. Pending Sales
# Months of supply: Down 35% from March 2019
Supply was low, but only a little lower than February. “Normal” is 5 months. Supply was low, but this is nothing new.
If you can’t see the chart, go here. Months of Supply (Absorption Rate)
Real Estate Market Statistics: Ventura County Zip Code Level
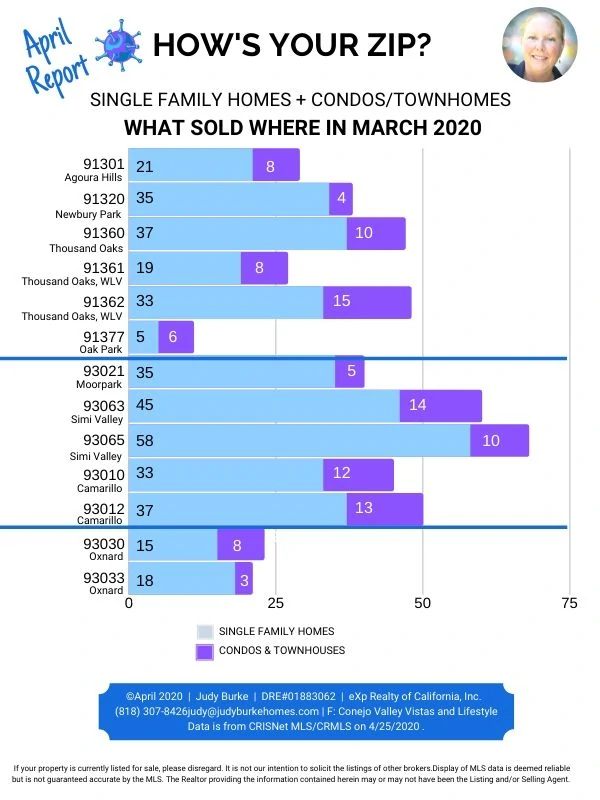
This shows how specific zip codes compared to each other.
Absorption Rate and Low Supply
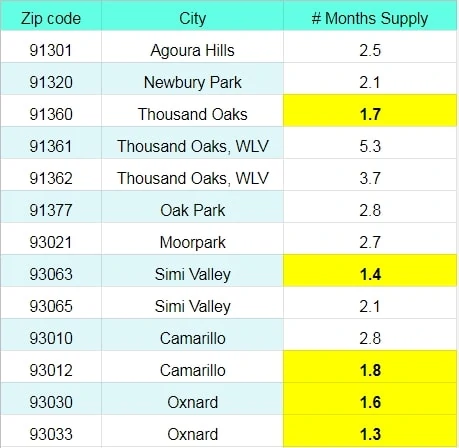
Take a look at everything highlighted in yellow. Although Ventura County inventory would run out in 2.5 months, some zips are UNDER 2 months of supply.
Absorption Rate or Months of Supply shows how long it would take to sell the existing inventory if no new homes came on the market.
Absorption Rate is calculated based on current inventory divided by the average monthly pending sales from the last 12 months.
Absorption Rate for Our Area
Thousand Oaks, Simi Valley, Camarillo, and Oxnard were under 2 months of Supply.
What Buyers Need to Know
There is less to choose from. Hint: If you are a buyer and you like something, decide quickly and offer strong. You might only get one chance if there are multiple offers.
You will be scrutinized by your lender. They’re gravitating towards safety. They’ll make sure you’re working and still have a job as your purchase moves through escrow.
Be patient. This virus is new to all of us. Stay cool and calm. Roll with it. This is the time for patience and flexibility.
What Sellers Need to Know
This is still a seller’s market. A low supply of active listings and low months of inventory means less competition and is likely good news to your ears.
On the other hand, your goal is to get your property into escrow as soon as possible if you want to avoid showing after showing.
Everyone is having to deal with the new rules. Stay positive. Keep your wits. Eye on the prize.
A Peek at the Nearby Valleys
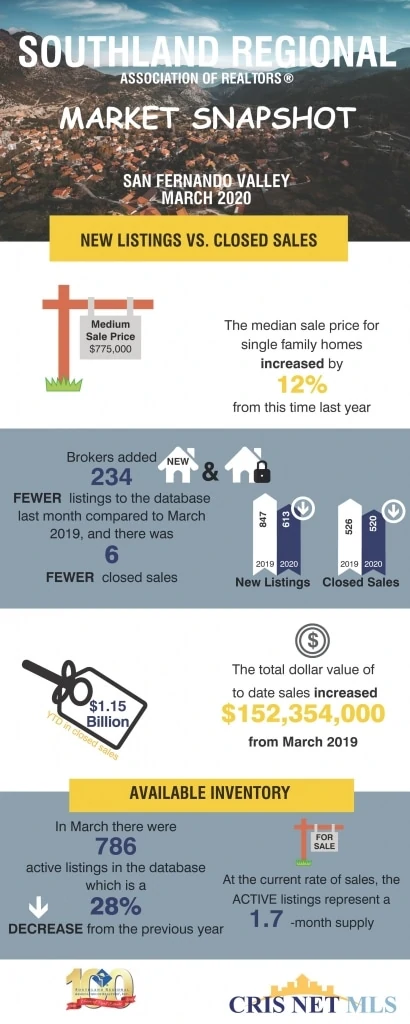
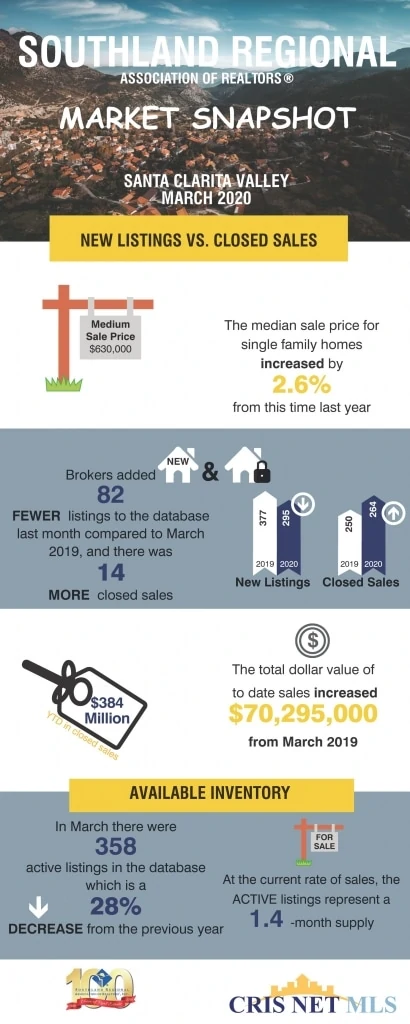
The San Fernando Valley and Santa Clarita Valley continue with extremely low inventory.
The San Fernando Valley and Santa Clarita Valley: Still Tight Inventory
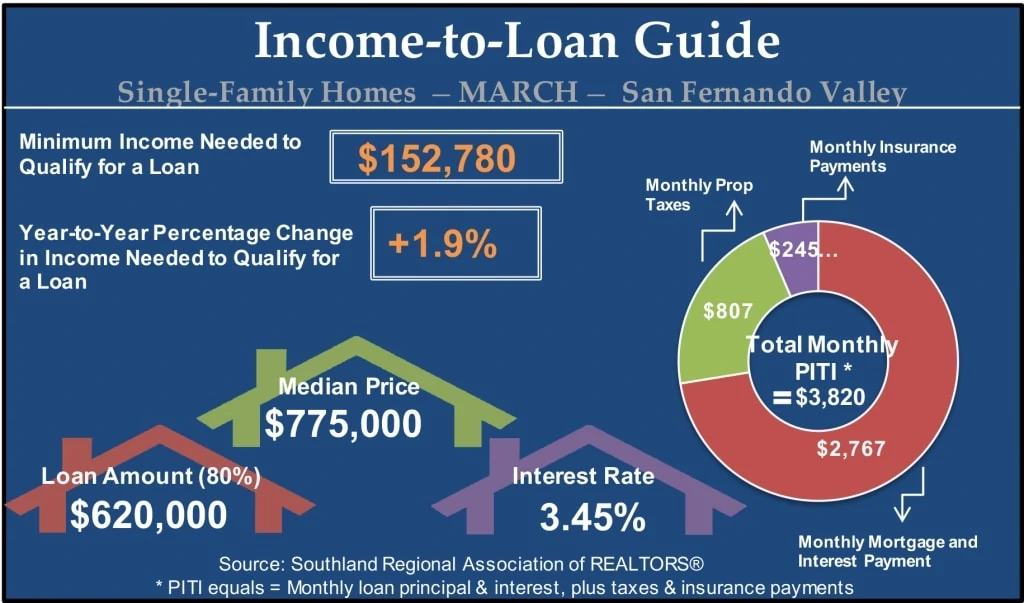
Mortgage Income Requirements
Wrap Up and My Two Cents
We’re in uncharted territory with this virus. With supply so very low, prices remained strong in March.
And potential sellers, It’s a good time to get your house ready to sell while you’re sheltering-in-lace. Just think, Home Depot is one of the only non-restaurant stores you can go to!
Supply is low and people still want houses and need a place to live.
Think with your own brain and don’t let the news mess with your head. Look at the data and facts and make your best decision.
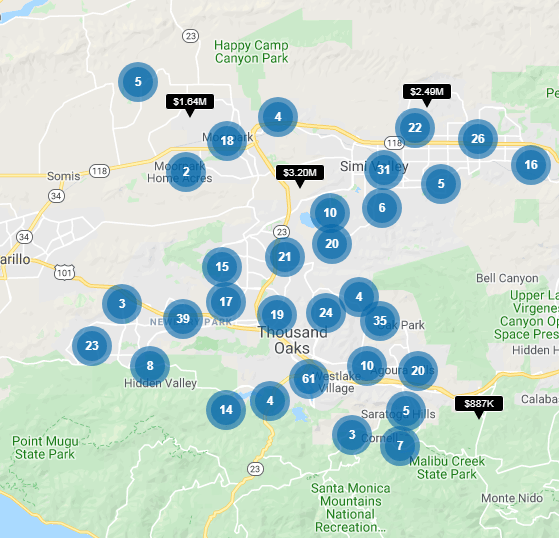
See all available homes
for sale in the
Greater Conejo Valley
Disclaimer
Based on data obtained from CRMLS/CRISNet MLS (Southland Regional Association of Realtors) and Infosparks on 4/17/2020 and 4/24/2020.
If your property is currently listed for sale, please disregard. It is not our intention to solicit the listings of other brokers.Display of MLS data is deemed reliable but is not guaranteed accurate by the MLS. The Realtor providing the information contained herein may or may not have been the Listing and/or Selling Agent.
Courtesy of Judy Burke | DRE#01883062 | eXp Realty


