Ventura County CA Housing Market Update – September 2024
September 2024 home sales report for Ventura County CA is now in.
We’ve passed the end of summer and we’re midway through the 3rd quarter.
Is the housing market different from September of a year ago? What exactly happened during August 2024’s home sales?
The Catalysts
Supply is the fuel. New Listings are the opening trigger. Then Pending/Under Contracts and Closed Sales follow. But did they?
Below is a graphic for single family home sales. This is August 2024 vs 2023.
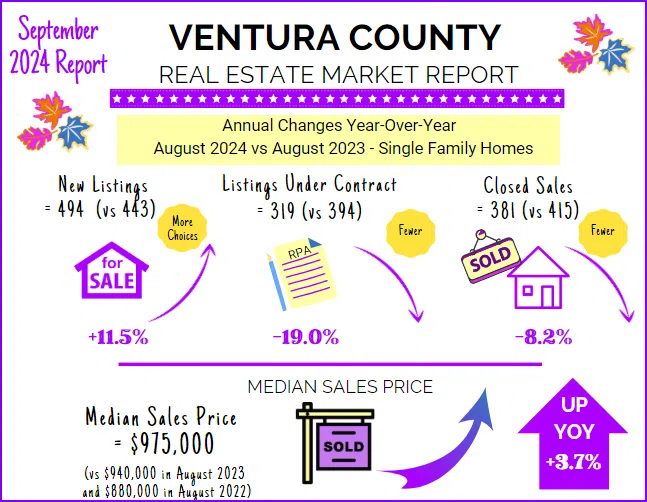
What’s important to note is that although new listings were up, escrows and closed sales were down for August vs the same month last year.
So more initial choices, but not as many actual homes sold.
Less activity in the final results category.
Not frozen but a cooler housing market than last year, at least as far as actual home sales go.
This was in the middle of the busy season. What’s going on?.
Theories and Ideas:
Many were expecting interest rates to go down, and are waiting for more cuts, so waiting on the sidelines?
Or they were out of town on last minute vacations before kids’ school resumed?
Or it was too hot outside to go home shopping?
Or affordability? More on that later.
Hmmm.
Median Sales Price
Here’s another thing to notice. Median Sales Price.
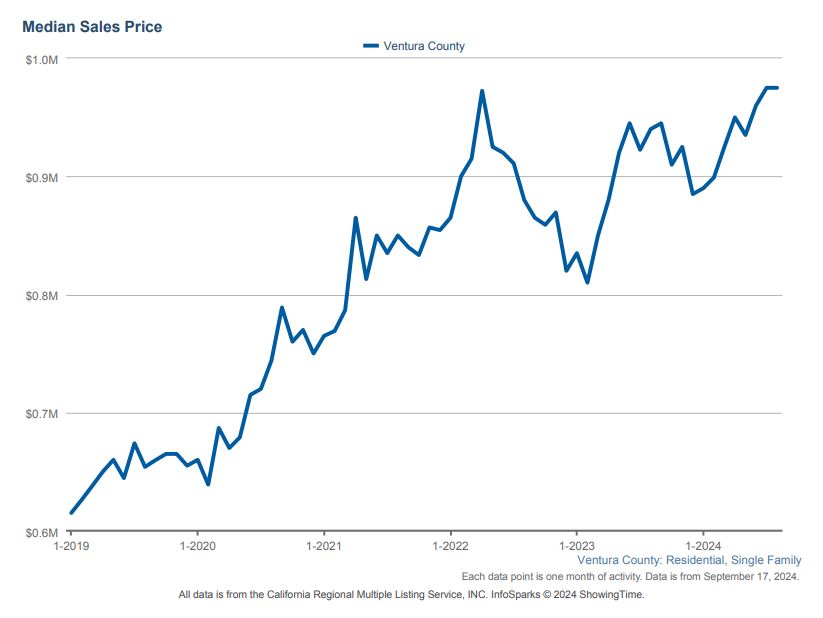
Take a look at the history in the graph below, in its historical context.
Median sales prices have moved up since the beginning of 2024, continuing an upward trend from 2019.
We had a major surge of home prices and sales in 2021 and 2022, and that adjusted once interest rates burst out in an upward direction in the beginning months of 2022.
Three points in 3 months was a shocker for everyone.
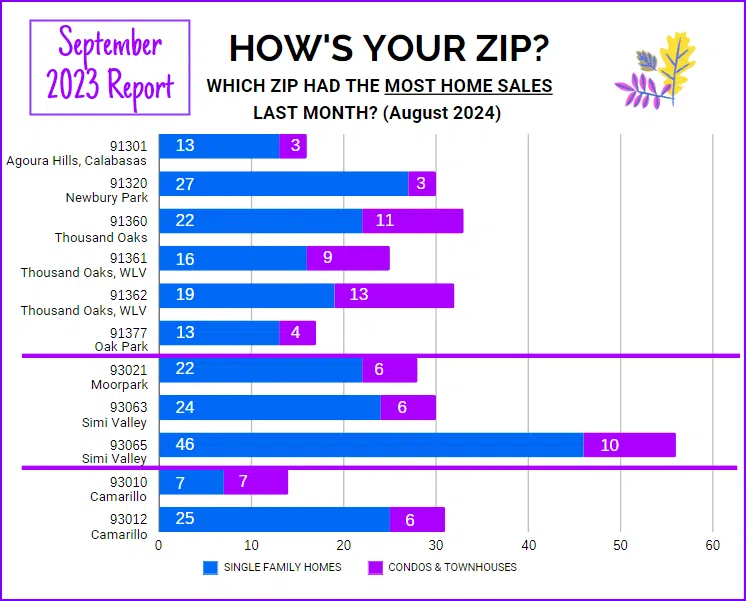
How’s Your Zip? A Local Perspective
It’s always the case that some cities have more home sales by month than others.
Here you can see which zip codes had the most activity.
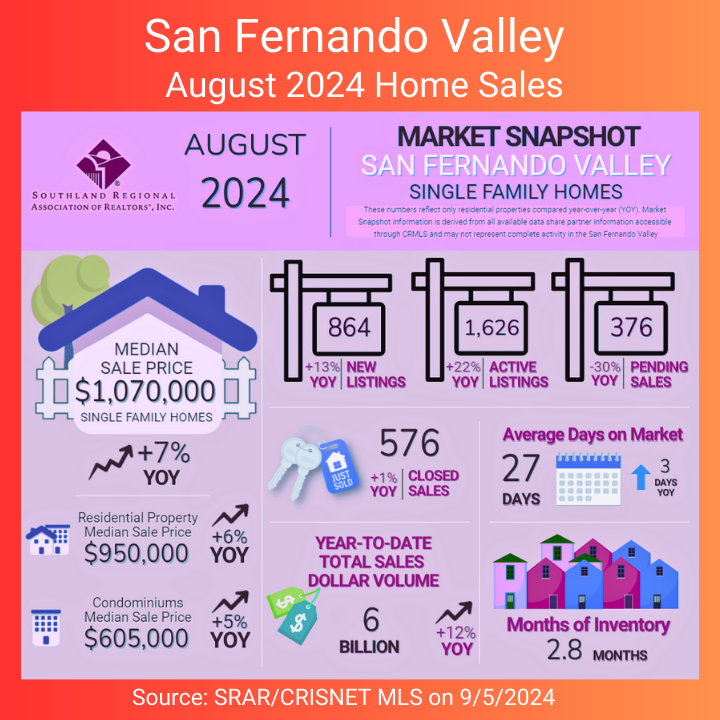
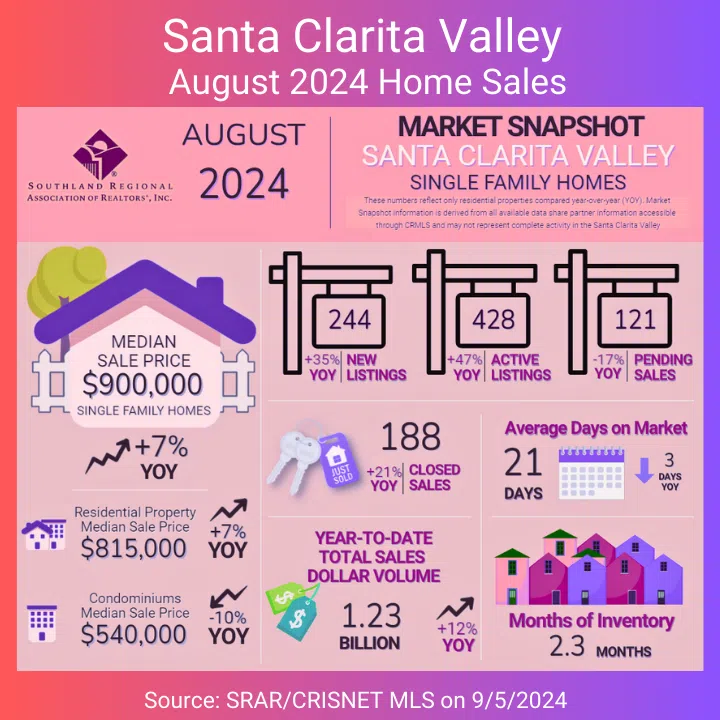
In the Nearby San Fernando Valley and Santa Clarita Valley
Think it’s different in Ventura County? Take a look at two nearby valleys.
Looking at Home Affordability in the CAR Report (California Association of Realtors)
It’s also good to take a look at things on the state and national level.
This may help explain why the sales are down.
Home affordability.
Take a look at the LA Metro area and the income required for this past quarter vs a year ago. Hmmm…
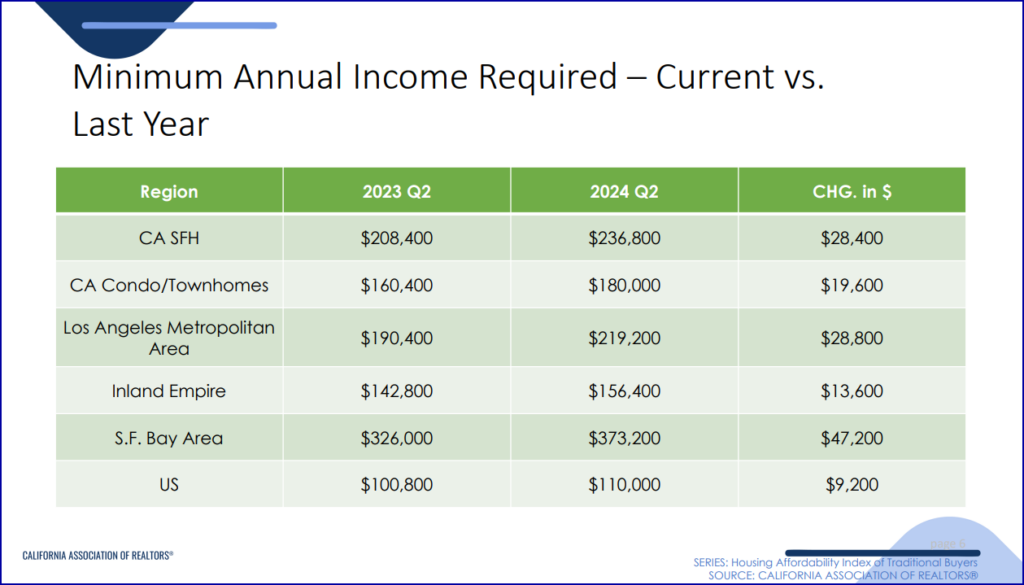
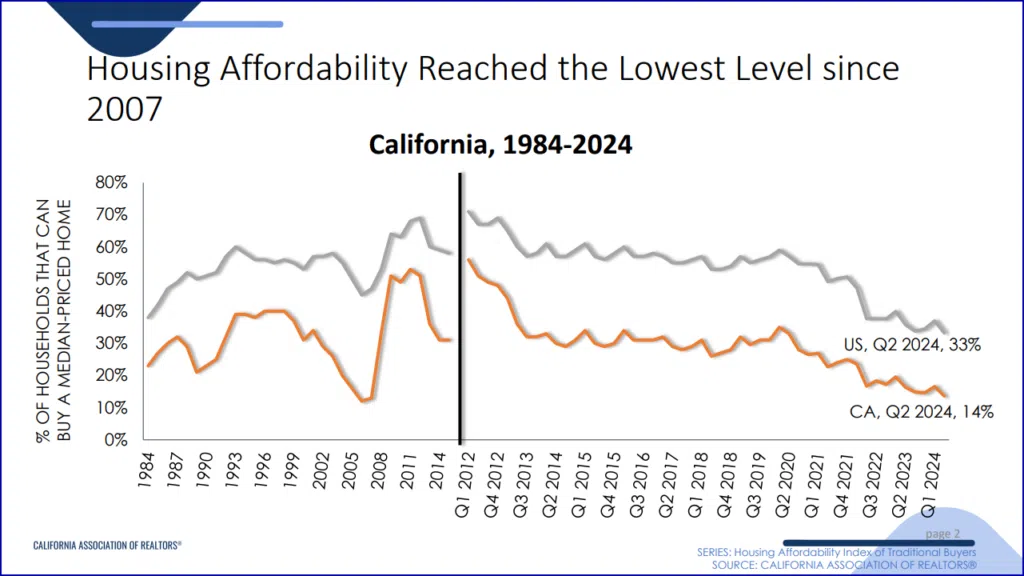
The next chart is extremely interesting. It’s for the state as a whole, compared to affordability in the US overall.
CA overall is down to 14%. I would wager that Ventura County and Los Angeles County are lower. I don’t have a chart for that, though.
If you want to see the entire report, here’s a link to the California Housing Affordability Update.
Wrap Up
Watch the data.
Also, there have been changes for both buyers and sellers as a result of the NAR settlement. It’s not over yet. It’s a work in progress that has caused quite a bit of confusion.
The market is always changing, always.
I can be of help or if you need any additional information, just let me know.
Want to see which homes are for sale right now
in Ventura County?
Want to see which homes are for sale right now
in Ventura County?
Disclaimer
Based on data obtained from CRMLS/CRISNet MLS (Southland Regional Association of REALTOR®) and InfoSparks on 9/17/2024. Also SRAR’s MLS on 9/5/2024 as noted for the 2 valleys.
If your property is currently listed for sale, please disregard. It is not our intention to solicit the listings of other brokers. Display of MLS data is deemed reliable but is not guaranteed accurate by the MLS. The REALTOR® providing the information contained herein may or may not have been the Listing and/or Selling Agent.
Courtesy of Judy Burke | DRE#01883062 | eXp Realty
