November 2024 Home Sales Report: Surprising slowdown?
We’re in the second-to-last home sales report for 2024, in the mid-Fall market, partway through the last quarter, with the end of the year soon approaching.
Typically, the home sales market in Ventura County CA slows toward year end. Is it any different this year? Are we in the middle of a “surprising slowdown,” or are we experiencing a decrease in activity that is typical for this time of year?
The Ventura County CA Housing Market
Keep in mind that we are looking back at October 2024, with a year-over-year comparison below.
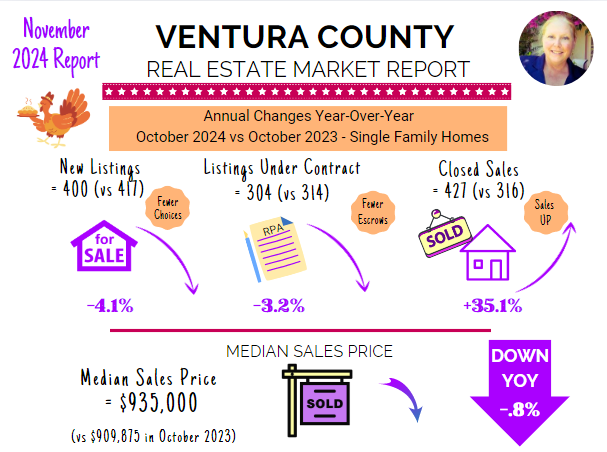
This first graphic shows the big picture of number of sales and price.
Home sales are up. There was a slight decrease in Median Sales Price.
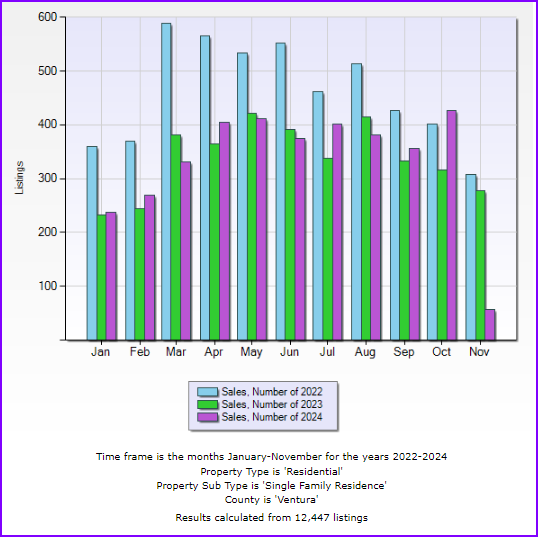
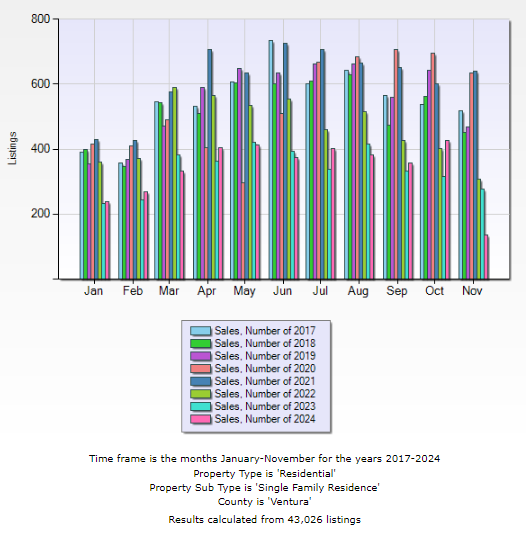
The Last 3 Years: Number of Closed Sales
Home sales comparison for the last 3 years is shown below. The interest rate increase in early 2022 produced a reduction in the number of home sales in general. The decrease began in the first quarter of 2022, and it continued into years 2023 and 2024. These years have been similar to each other since the interest rate increase.
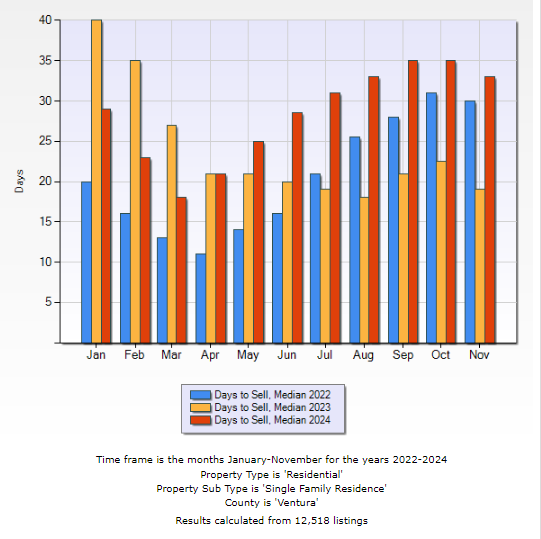
Time on Market & Time to Sell INCREASING
This answers the question whether we’re in a “surprising slowdown” or not. What we know is that it took longer to an accepted contract for the month of October 2024 compared to previous years, with a corresponding increase of supply.
To really see how this compares to previous years, see the graph below.
The Last 3 Years: DOM or Days on Market
Pay particular attention to the 2024 bars in RED. Median Days to Sell AKA Days on Market (DOM) is notably higher since the beginning of this year.
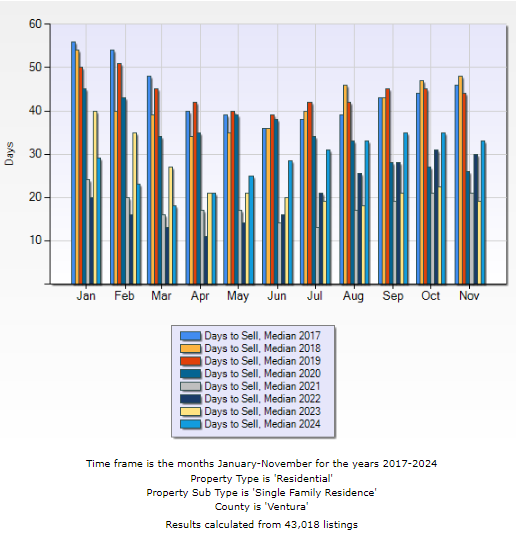
Since 2017
(Sorry for the colors changing. 2024 is now blue). It’s important to see the historical context. Notice how 2017-2019 had much higher Median Days on Market (Days to Sell).
The extremely low time to an agreed purchase contract has not always been as low as it currently is. Just look what the market was like in 2017-2019.
How’s Your Zip? Hyperlocal Market Stats
It’s worth looking at both September and October to see how they compare. Sales are up for October, compared to September, just one month before.
Here are a few of the nearby cities that I focus on, in the Conejo Valley, Simi Valley, Moorpark, and Camarillo.
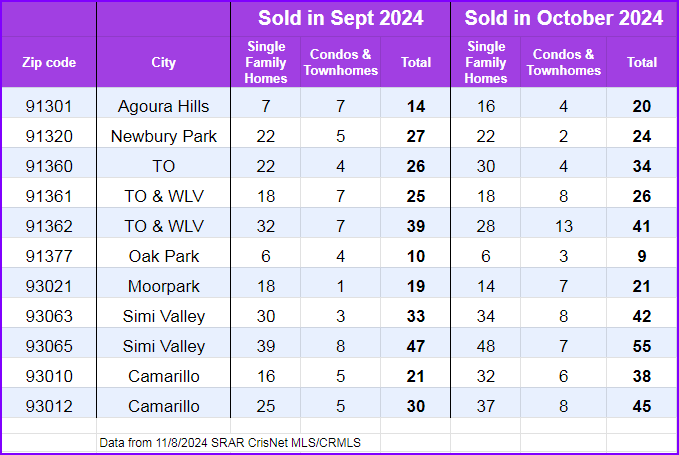
Seeing the months side by side gives a much clearer picture than the one year look-back.
To see the October 2024 complete report that is in last month’s blog, see the October Market Report.
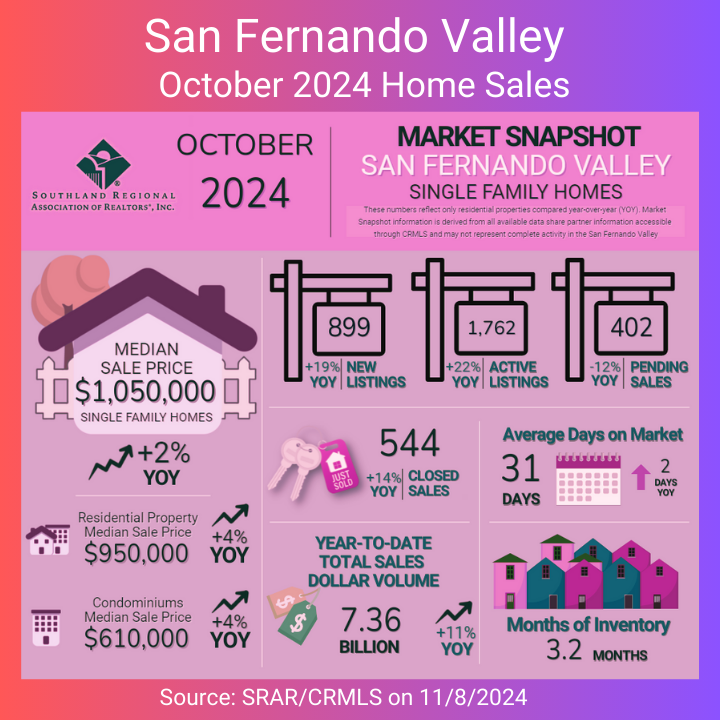
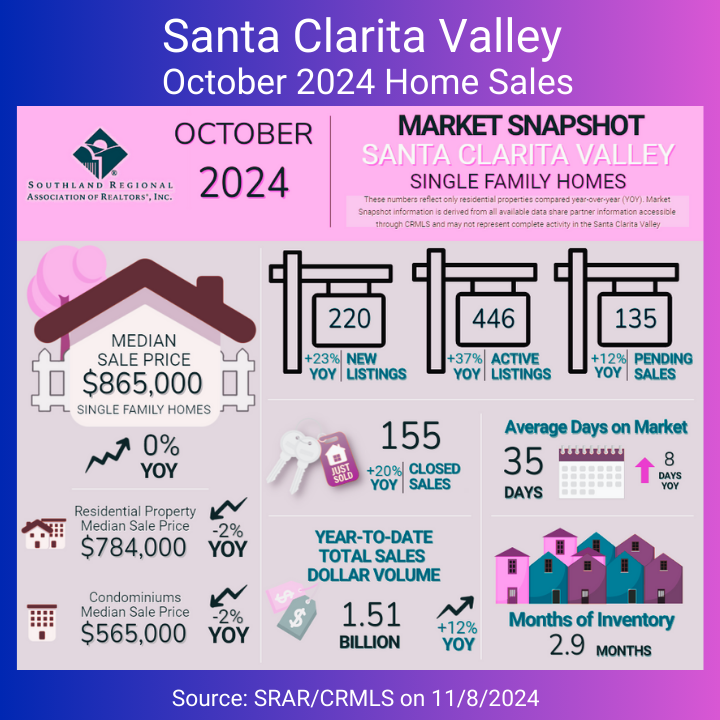
Nearby San Fernando Valley and Santa Clarita Valley
Wrap Up
Everyone is watching to see when and if the anticipated interest rate decreases actually materialize.
Be sure to consult with your realtor to keep abreast of ongoing changes. If you are a buyer, be sure to monitor things with your lender regarding interest rates. This can have a significant impact on your purchasing ability.
I can be of help or if you need any additional information, just let me know.
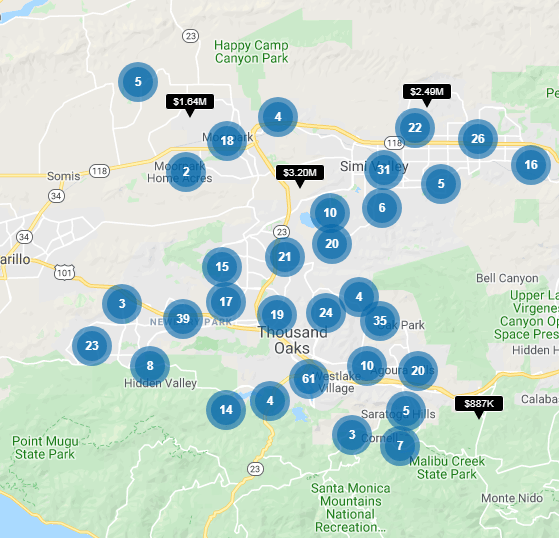
Want to see which homes are for sale right now
in Ventura County?
Want to see which homes are for sale right now
in Ventura County?
Disclaimer
Based on data obtained from CRMLS ((Southland Regional Association of REALTOR®) and InfoSparks on 11/8/2024 and 11/13/2024.
If your property is currently listed for sale, please disregard. It is not our intention to solicit the listings of other brokers. Display of MLS data is deemed reliable but is not guaranteed accurate by the MLS. The REALTOR® providing the information contained herein may or may not have been the Listing and/or Selling Agent.
Courtesy of Judy Burke | DRE#01883062 | eXp Realty
