Ventura County Housing Market Update – May 2022
Reminder: For May’s report, we are looking at what sold in April. If you want to see what sold in March, see the APRIL HOME SALES REPORT.
Here’s what makes the 2022 Ventura County home sales market different: Interest rates have gone up 2 points since the beginning of the year, all over the country.
Ouch.
They’ve eased a little in the past week, but they’re still up.
Buyers still want to buy, but that increase in payment has got to hurt.
And what about the housing supply? Do we have the typical spring surge?
There are several factors to consider:
- Closed Sales, New Listings, Pending Sales, Active Listings – How many? What’s the supply like?
- Days on Market – How fast do homes get an offer?
- Sales to list price ratio – How much are buyers willing to pay over asking?
- The Big Picture: Home Sales Bird’s Eye View
- Real Estate Market Data: Closed Sales – THE REAL BOTTOM LINE
- Inventory
- Days on Market: Selling Fast Continues
- Median Sales Price: The Climb Continues
- Real Estate Market Statistics: Nearby San Fernando Valley & Santa Clarita Valley
- What Buyers Need to Know
- What Sellers Need to Know
- Wrap Up
The Big Picture: Home Sales Bird’s Eye View
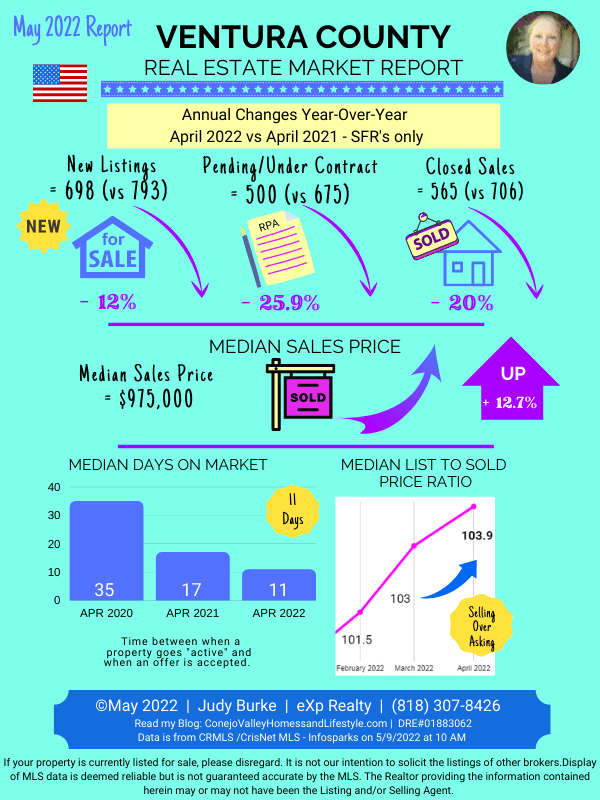
Real Estate Market Data: Closed Sales – THE REAL BOTTOM LINE
When we talk number of properties, this is the category that really counts. Actives and Pending numbers change throughout the month as properties go in and out of escrow. New Listings shows the willingness of sellers to sell. The hard core final figure that matters is the actual solds.
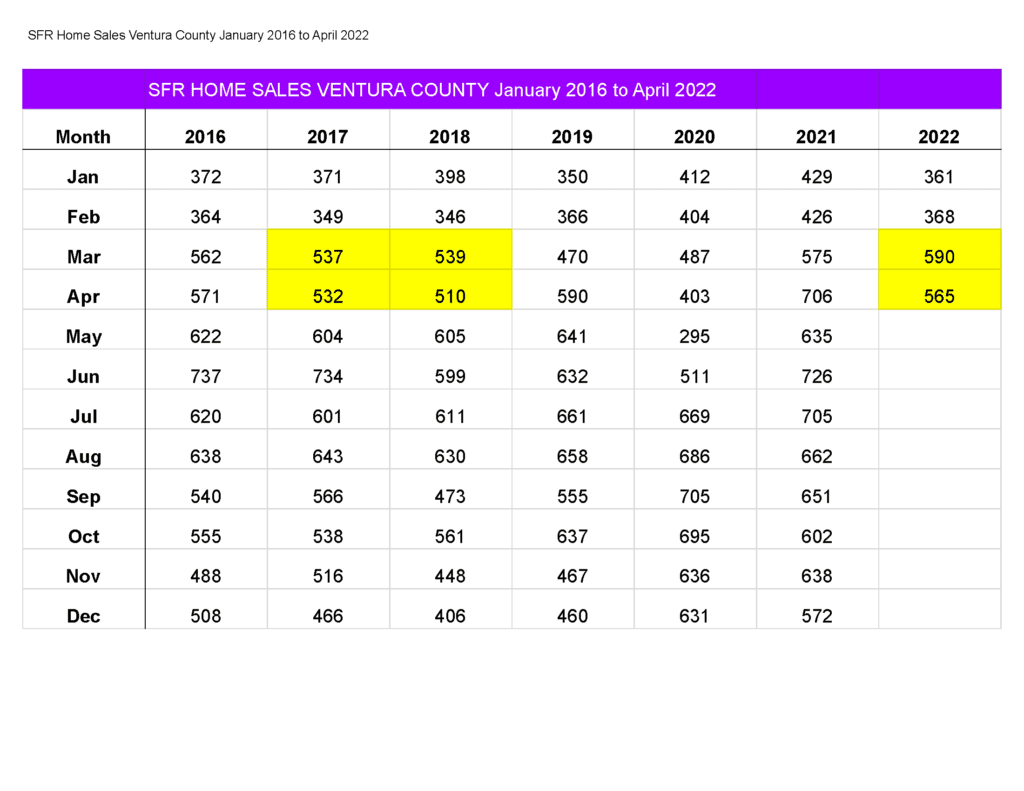
Here’s what the past 7 Aprils of home sales looked like.
April 2021 was the record-breaker of recent years. We didn’t beat it in 2022.
- April 2016 429
- April 2017 532
- April 2018 510
- April 2019 590
- April 2020 403 (during the shut-down, some record-breaking months)
- April 2021 706 (record-breaking year overall)
- April 2022 565
The 2022 year in the chart below is hot pink. Years 2020 and 2021 were “unusual” years. (Unusual globally an understatement.) 2022 is more in line with previous years of 2019 and prior.
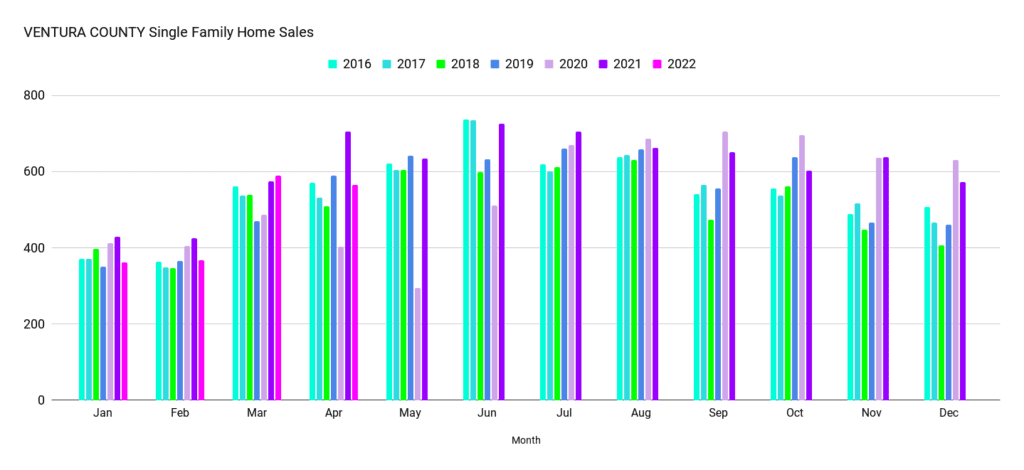
In addition, home sales DECREASED from last month. No surge there. We’ve seen this before, where April had fewer sales than March. It happened in 2017 and 2018. See the yellow highlights.
The REAL bottom line will be in a couple months in July/August, when home sales typically peak. Then we’ll see whether an actual surge happened or not.
Inventory
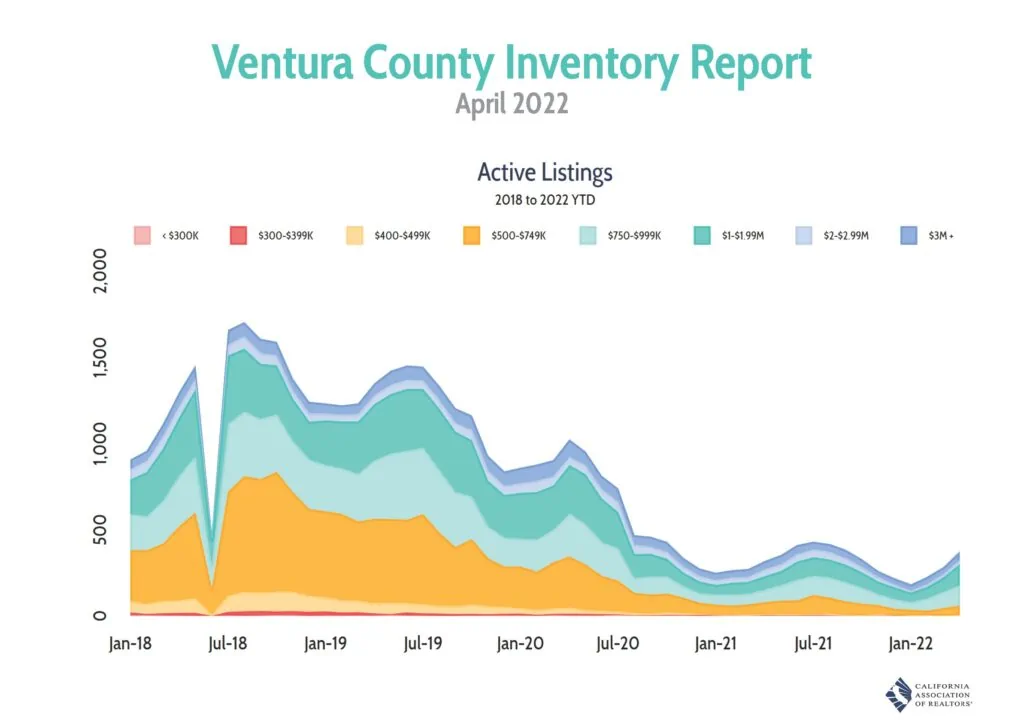
Below is an interesting chart of active listings from the California Association of REALTORS®. This breaks it into price tiers. Keep in mind that “active” is anything with a for sale sign that is on the market or pending, but not closed yet. “Someone was trying to sell it” is a more accurate description.
I prefer to monitor the concrete category of “sold”. Either it did or it didn’t.
Days on Market: Selling Fast Continues
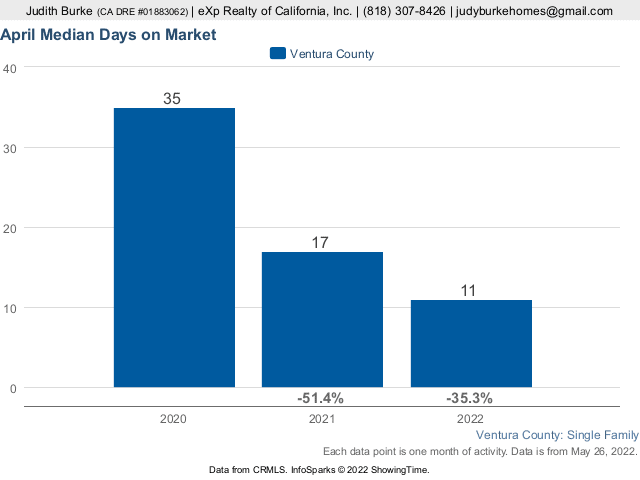
Days on Market is the length of time between when a property goes on the market and when it gets an accepted offer.
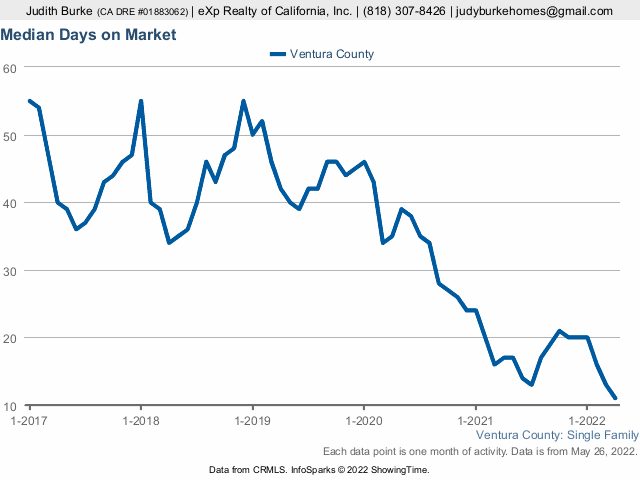
We’re at 11 Days on Market. That’s tiny.
And here’s the visual plunge in Days on Market over the past 5 years.
Median Sales Price: The Climb Continues
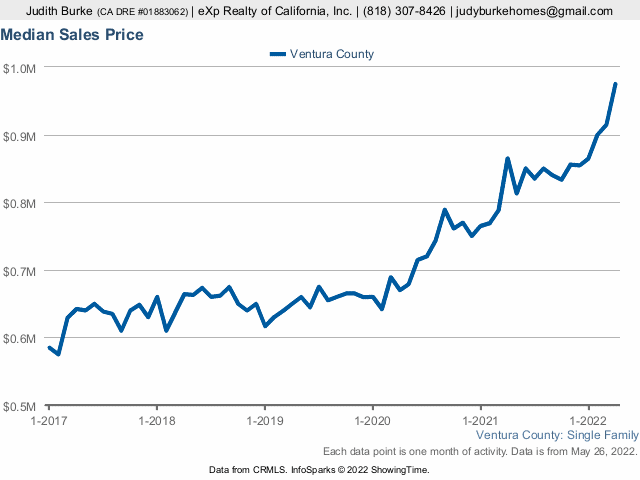
Median sales price of $975,000. Up again.
The Hyper-Local Picture: A Newbury Park Surprise
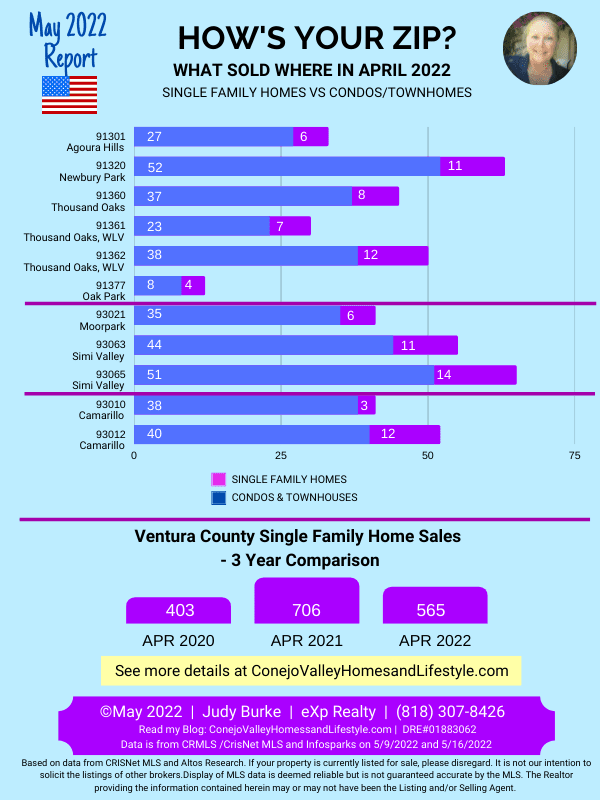
The graph below shows monthly activity in specific zip codes. Simi Valley is the usual monthly leader, but look at the surge in sales in Newbury Park.
Real Estate Market Statistics: Nearby San Fernando Valley & Santa Clarita Valley
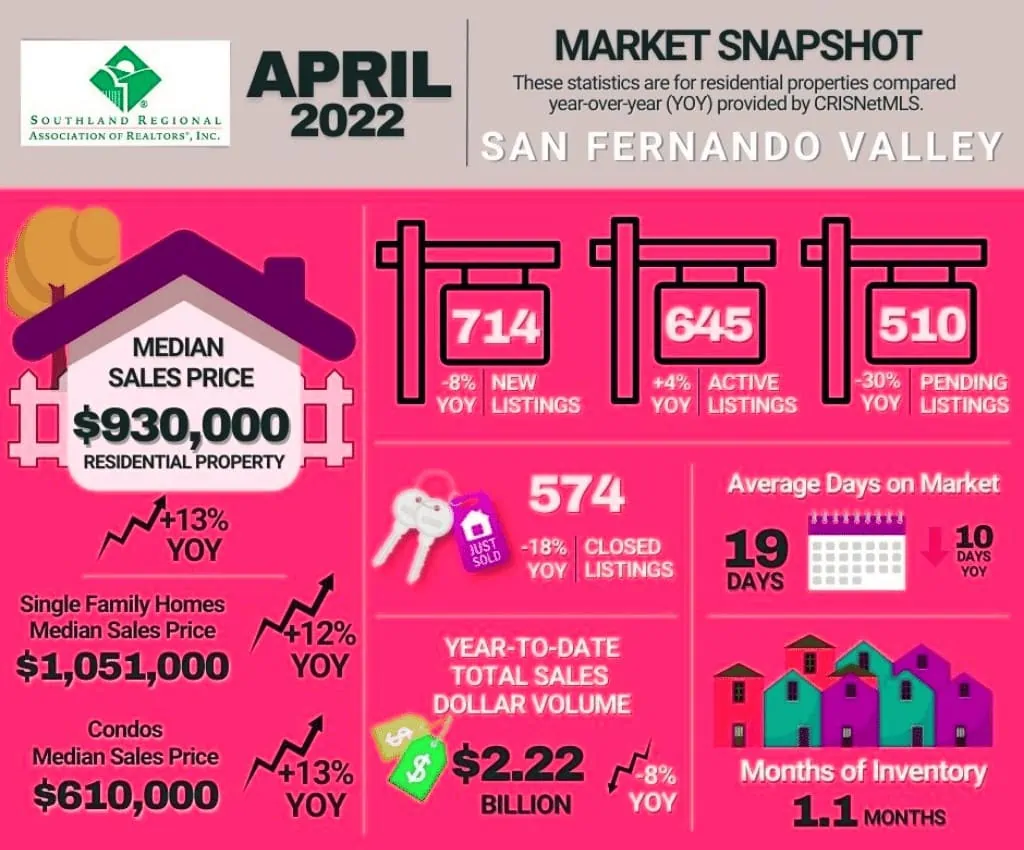
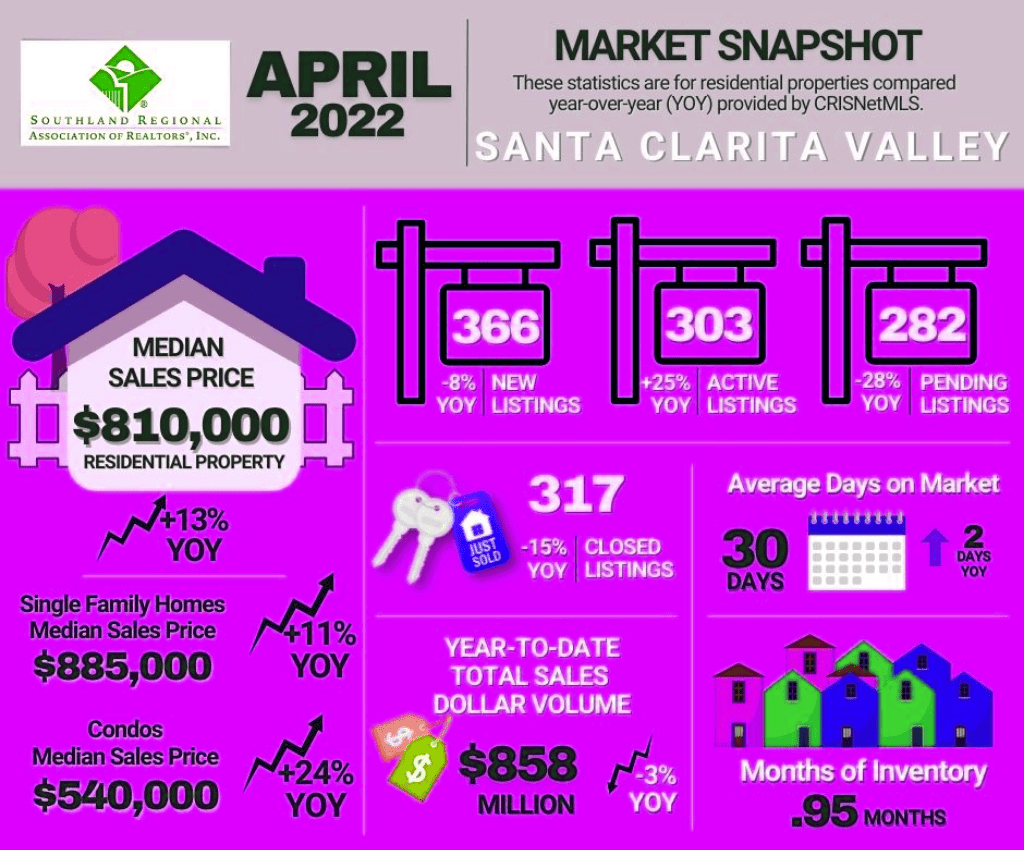
Here’s a market snapshot for April 2022 showing activity in 2 nearby valleys. It echos what we see in Ventura County.
What Buyers Need to Know
Be completely ready to go. Make sure your lender can perform quickly.
Watch the interest rates like a hawk.
Before offering, run the figures by your lender to make sure the payment and ratios still work.
With homes going out above market, search BELOW your maximum affordability. You need price wiggle room to allow for going over asking if there’s competitive bidding.
Make sure you understand the implications of waiving contingencies in this market. Talk with your realtor about how this works.
What Sellers Need to Know
PUT a realistic listing price on your property. We’re seeing some price reductions.
MAKE YOUR HOME SPARKLE to get the maximum sales price. Consider a professional deep cleaning.
CONSULT AND STRATEGIZE with your REALTOR® before making fixes or improvements. Some repairs pay off and others don’t. Don’t fix the wrong thing or ignore the necessary thing. (Some fixes are necessary, but don’t pack a lot of emotional punch. For example, a working roof and a working air conditioner and furnace are necessary, but nobody gets excited about them. You still need them.)
For a top selling price, you’ll need to put on the glitz and go beyond ordinary, but you want to put the glitz in the right place so that it’s not wasted.
Wrap Up
Mr. Toad’s Wild Ride continues. We’re still on one of those twisty, crazy roller coaster rides at Magic Mountain. The good news is that we’re supposedly moving to a more balanced market vs the extreme seller’s market that we’ve been in. Balanced/normal could be good.
If I can be of help or if you need any additional information, please don’t hesitate to contact me directly.
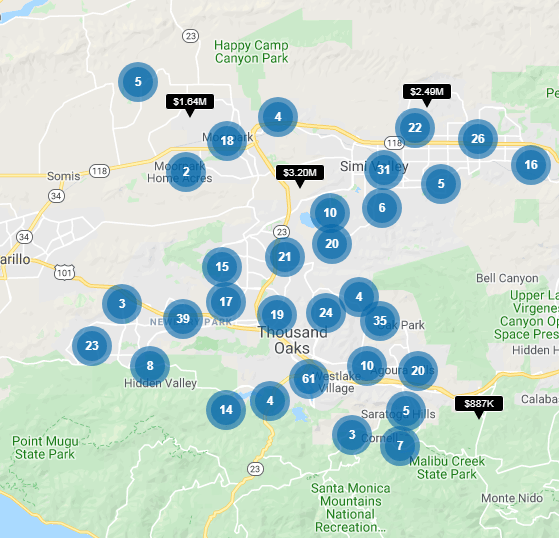
Want to see which homes are for sale right now
in Ventura County?
Want to see which homes are for sale right now
in Ventura County?
Disclaimer
Based on data obtained from CRMLS/CRISNet MLS (Southland Regional Association of Realtors) and InfoSparks on 5/9, 10, 16, 26/2022. If your property is currently listed for sale, please disregard. It is not our intention to solicit the listings of other brokers. Display of MLS data is deemed reliable but is not guaranteed accurate by the MLS. The REALTOR® providing the information contained herein may or may not have been the Listing and/or Selling Agent.
Courtesy of Judy Burke | DRE#01883062 | eXp Realty


