Ventura County Home Sales Awesome Increase: More Homes Sold than Last July
Yes, MORE single family homes sold in July 2020 than in July 2019. How can that be!?!
We’ve had such a pattern of low activity so far this year with the pandemic. Last month’s report (for July 2020) showed an improvement, but this month shows a July that was better than pre-pandemic. Yes, better than “normal.”
July 2020 home sales and pending sales were UP!
Wow.
An Issue of Supply
Supply was still tight, but there were more choices. To be specific, 816 SFR’s were new to the market in July 2020 vs 695 the previous month. More choices equals more sales for eager buyers.
It’s impossible to find a home with nothing to choose from, and that has been a painful problem for local buyers. No supply, low supply, just not enough homes for the increased demand.
- An Issue of Supply
- Remember the 30-45 Day Look-back
- Real Estate Market Trends: Ups and Downs
- Real Estate Market Data: July’s Numbers
- Significance of “New” Listings over “Actives”
- Real Estate Market Statistics: How’s Your Zip?
- Months of Supply (aka Absorption Rate)
- What Buyers Need to Know
- What Sellers Need to Know
- A Guide on Shopping For Homes During A Pandemic
- Nearby San Fernando Valley
- Wrap Up
Remember the 30-45 Day Look-back
Just a reminder that in terms of evaluating the condition of the market for August’s report, we are looking at the month of July 2020.
The look-back period still applies. That puts mid-May to late-June as the window when houses went under contract, resulting in a close sometime during July. This is calculating a 30-45 day escrow period.
Those home buyers had lead time even beyond that.
This means that in spite of being in early stages of opening up in Ventura County, people were still venturing out to buy houses. The “stay home” didn’t stop them from shopping or buying.
Housing supply has been a weak link in home sales recovery that was deeply impacted by the pandemic and its resulting shutdown. Nevertheless, the housing market’s resiliency is “remarkable,” according to NAR Chief Economist, Lawrence Yun. Read about it here.
Real Estate Market Trends: Ups and Downs
Real Estate Market Data: July’s Numbers
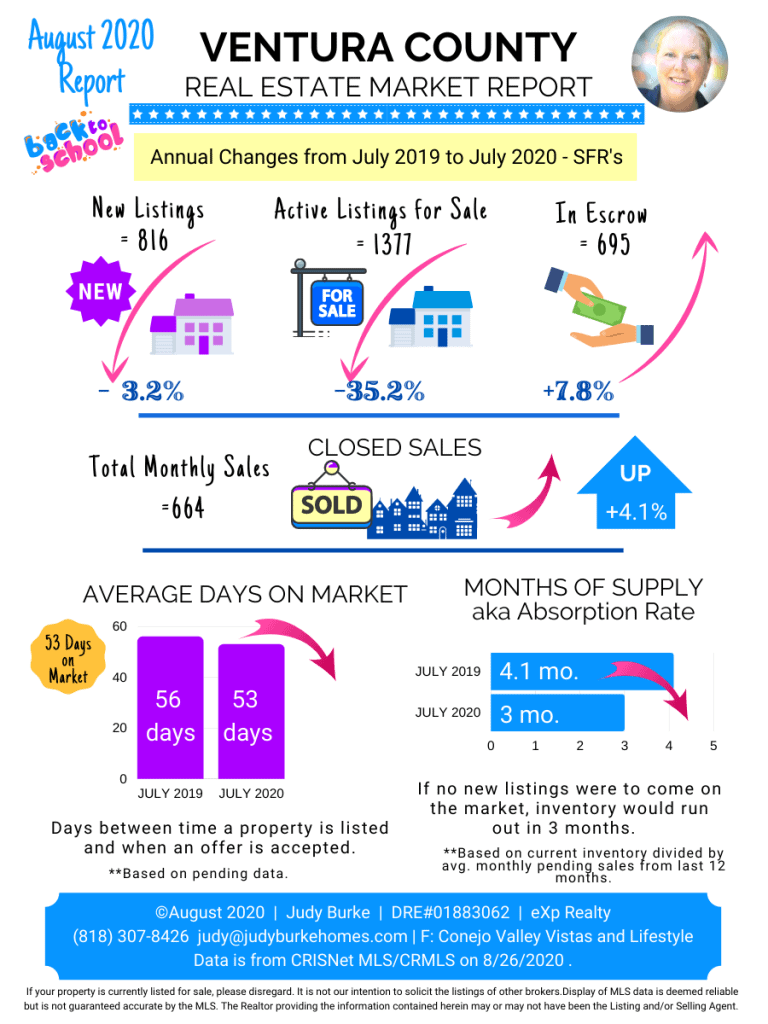
Here’s a summary of July 2020 data on home sales market statistics for residential single family homes.
- Median single family home sales price:
- UP 5.9% YOY
- July 2020 = $720,0000 vs July 2019 = $680,000
- Increased median sales price
- Average single family home sales price:
- UP 3.3% YOY
- July 2020 = $893,258 vs July 2019 = $864,458
- Increased average sales price
- New listings:
- DOWN 3.2% YOY (May 2020 was down 29.6% YOY)
- July 2020 = 816 vs July 2019 = 843
- June 2020 had 695 new listings, so they were up month-over-month (MOM).
- Active listings:
- DOWN 35.2% YOY
- July 2020 = 1377 vs July 2019 = 2125 (700 fewer actives for sale this year. Wow.)
- June 2020 had 1446. Fewer active listings this month than last.
- Pending sales: MORE THAN LAST YEAR
- UP 7.8% YOY -Definite improvement!
- July 2020 = 695 vs July 2019 = 645 (similar volume)
- June 2020 had 630. That’s 65 more escrows than last month. An improvement, but not as much as last month.
- Closed sales: MORE THAN LAST YEAR
- UP 4.1%
- July 2020 = 664 vs July 2019 = 638
- This is the most important category. What actually closed escrow.
- June 2020 had 507. More sales than last month.
Pending sales and closed sales were HIGHER than a year ago. Amazing.
Active listings in the context of this report represent all homes that are in the process of being sold. This category encompasses the MLS categories of Active, Active Under Contract, and Pending. In other words, they are at any stage of “for sale”, but have not sold yet.
Significance of “New” Listings over “Actives”
When looking at supply, I prefer to look at the category of “New Listings” as opposed to “Active Listings.”
“New” is measurable within a specified period, in this case a calendar month.
“Active” is measurable on a particular day. It is a snapshot of which properties were either Active, Active Under Contract, or Pending on a given date. What I don’t like about this is that the date of the reading is generally unknown. Also, the numbers shift from day to day, so you need to do it the same day at the same time of every month. Unfortunately, most programs pick the date for you.
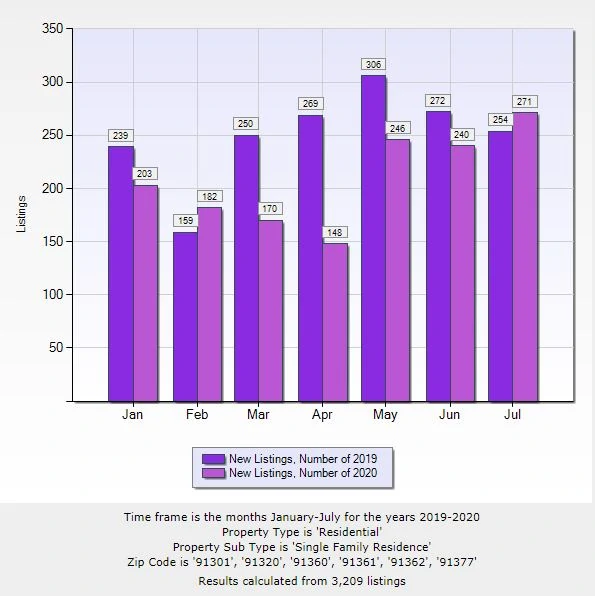
As you can see above, New Listings increased YOY in the Conejo Valley for single family homes. Just like what we see in Ventura County as a whole, we see the same trend repeated in the smaller sample of Conejo Valley homes.
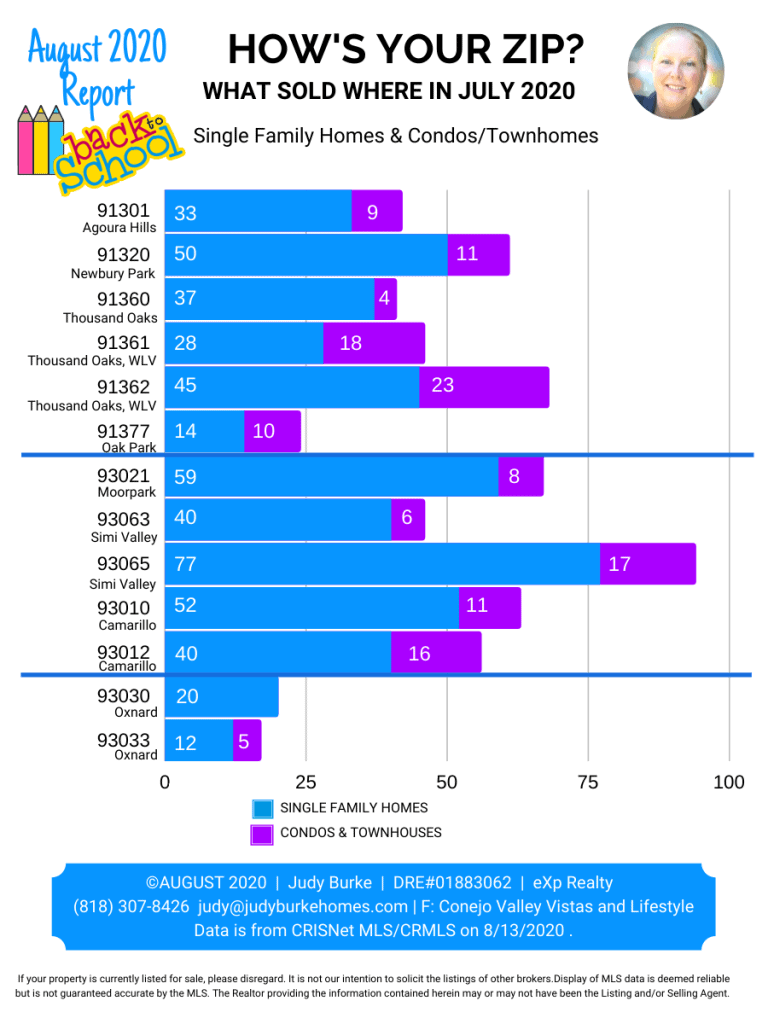
Real Estate Market Statistics: How’s Your Zip?
Months of Supply (aka Absorption Rate)
Absorption Rate or Months of Supply shows how long it would take to sell the existing inventory if no new homes came on the market.
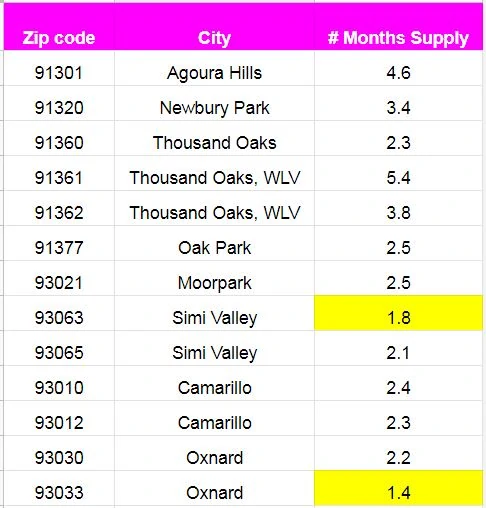
I like to think of Months of Supply as how fast houses fly off the shelf. Do they linger or do they get zapped up quickly?
A “normal supply” is said to be 4-5 months, but we’ve been well under that for several years.
In the preceding chart, inventory remains low, with two zip codes under a 2 month’s supply. This has increased slightly, but overall supply is low and it is a seller’s market.
Absorption Rate is calculated based on current inventory divided by the average monthly pending sales from the last 12 months.
California Wildfires Readiness (2023)
Prepare now for California wildfire season
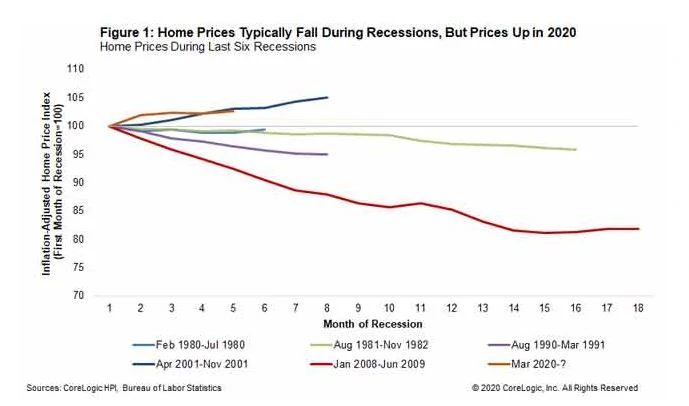
According to CoreLogic, July 2020 was a hot market, as far as activity goes. Read the full report.
California Wildfires Readiness (2023)
Prepare now for California wildfire season
The Hotness Factor
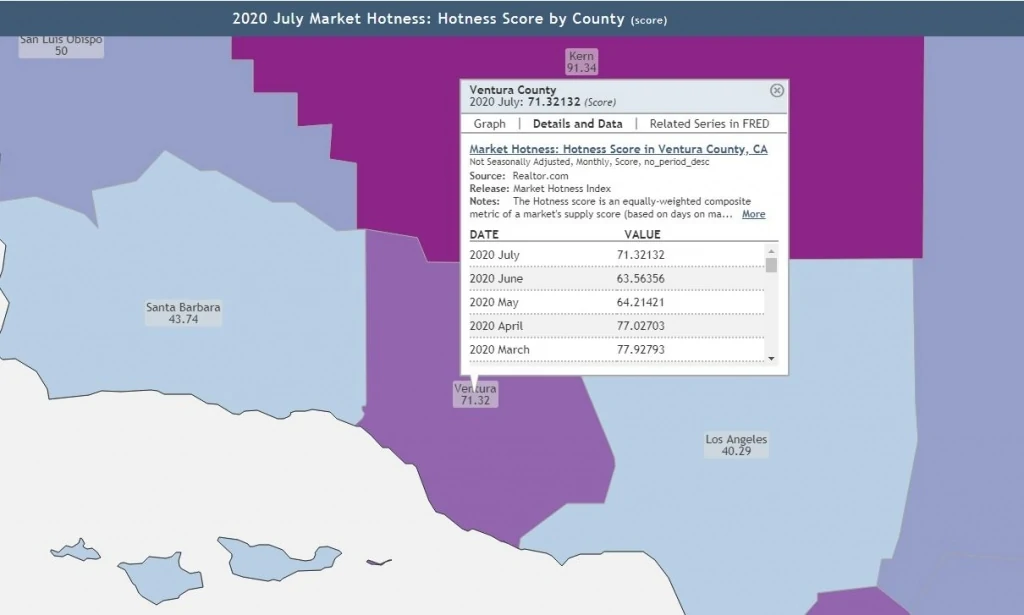
We’ve heard city vs suburb all over the news this past month. Ventura County’s death and case numbers are dramatically lower than Los Angeles County, so perhaps this is a factor?
Whatever the case, you can see in the chart above how Ventura County at 71.32 is a hotter market than Los Angeles County at 40.29.
Note in the drop-down that the Hotness Value increased from 63.56’s June 2020 figure.
And below, check out the live link where you can zero in on the map for various data values such as unemployment and demographic particulars. Enjoy!
What Buyers Need to Know
Make sure you have all your ducks in a row before you go shopping for a house. This is normal advice for a normal market, but it’s particularly important right now.
Competition is extreme. Interest rates are low, so buyers want to capitalize on the timing. Remember, you’re competing with others for the best houses.
Don’t take an “I’ll quit until there is less competition” attitude. Be prepared for the bidding to go over ask price.
This is not a looky-loo environment. You’ll be signing disclosures even to get in the door.
An ongoing reminder: Once you’re in escrow, you’ll be scrutinized by your lender until the bitter end. Due to the unemployment rate, you should expect that your lender will call your employer before funding in order to verify that you’re still working at your current job.
Don’t take the extra scrutiny personally. It’s part of the market we’re in right now.
What Sellers Need to Know
This is still a seller’s market and the pandemic hasn’t changed this aspect, at least not so far.
Price your home competitively, in line with the market. This is not a time to price it sky high and wait months to get an offer. It will sit.
A low supply of active listings and low months of inventory is likely good news to your ears, but your house still has to be appraised by the buyer’s lender. If the price gets bid up in a multiple counter situation, you might feel good about the rich price, but there is still the buyer’s appraisal to get past. The appraiser is likely to value your house closer to its earthly value, and the lender will lend based on that.
Showings are do-able, but most sellers consider them more of a hastle than in pre-Covid times. As far as prep for buyers coming inside, think “surgically clean.” People are pickier right now.
Photos are more important than ever. They show the good and the bad, so you need to put your best foot forward. If you need extra time to get your place perfect for the photographer, just let your realtor know. It’s better than presenting photos of an “unready” house.
Buyers will likely see your home in person before deciding to purchase, and they’ll be signing disclosure paperwork before setting one foot in the door with their realtor. This is a new protocol since the shutdown, and it encompasses the safety and distancing protocols that have been put in place since the start of the pandemic.
Stay positive. This is an amazing time to be a seller. It’s a seller’s market!
A Guide on Shopping For Homes During A Pandemic
People are still buying, sellers are selling, sales are closing. Showing rules are the new adjustment we all make to stay safe. Here are some things you need to be aware of as you start your home buying and selling process.
- No open houses permitted. VIRTUAL OPEN HOUSES only. Pictures are important!
- Virtual tours and 3-D photos are preferred, and buyer viewing photos is a prerequisite to showings. (Most people still need to see the house to make a decision.)
- Masks, gloves, hand washing/gel, remove shoes/use booties. Posted warning at door is now required.
- Same as last month: Mandatory signed disclosures to enter the property: EVERYONE.
- Same as last month: Sellers cannot be home during showings in order to prevent virus spread.
- Same as last month: Number of buyers at showings limited to 2. Don’t bring a friend. There are restrictions to protect both buyers and sellers.
- Same as last month: Serious buyers only (Lender pre-approval and proof of funds needed. No looky loos). Be sure to get pre-approved by your lender in advance. Some sellers require seeing source of funds and the pre-approval letter from your lender prior to showing.
Nearby San Fernando Valley
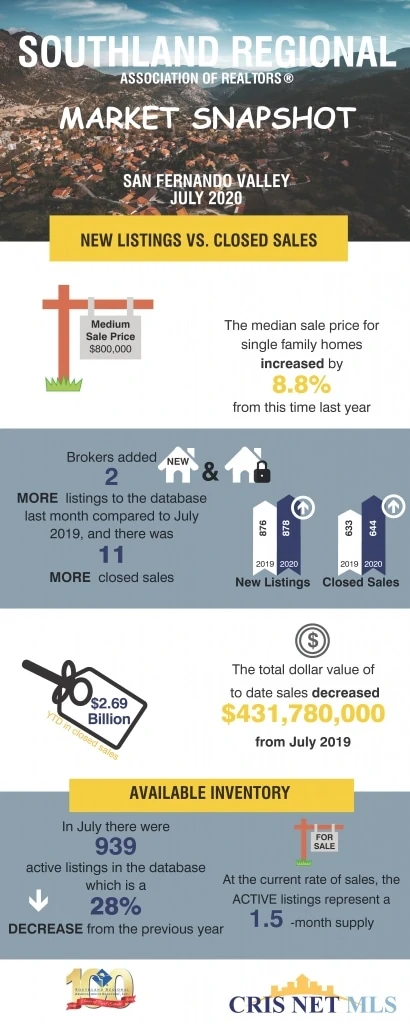
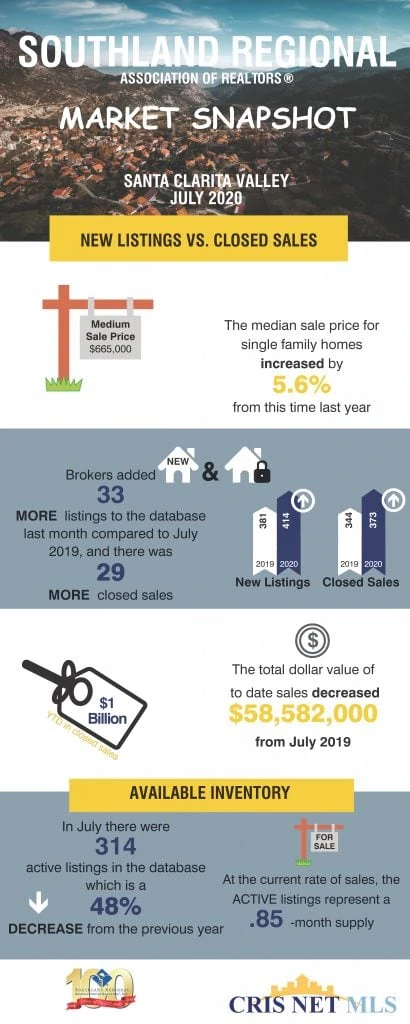
Check out the increase in opened escrows. Current 2020 year is the blue line.
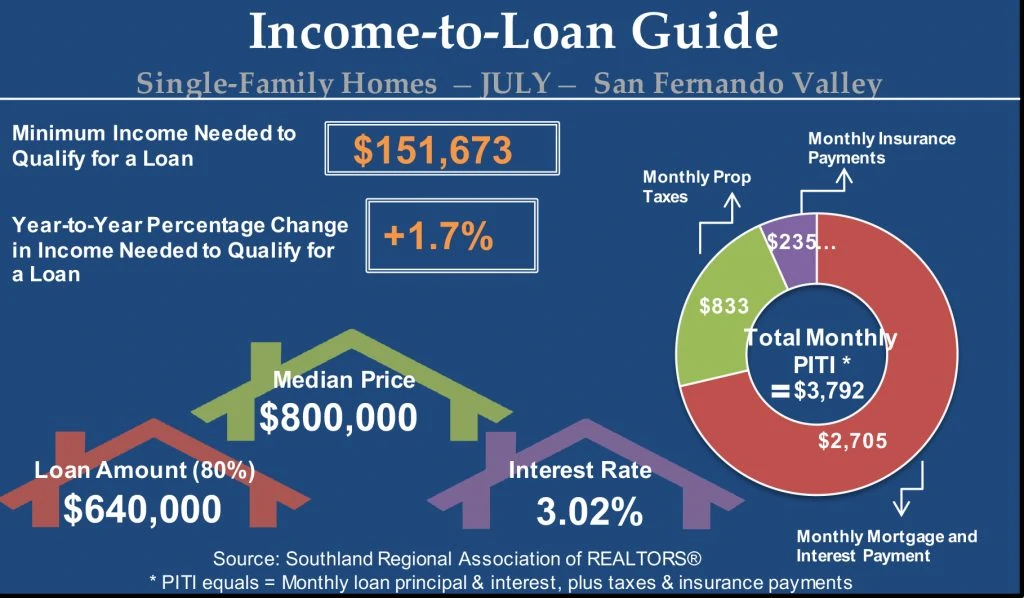
Mortgage Income Requirements-San Fernando Valley
Wrap Up
We’re in uncharted territory with this virus, and each month brings something different. With supply continuing to be low, prices continue to hold or increase.
Note to sellers: Keep on getting your house ready to sell while we go through an increasing opening up period.
Don’t let the news mess with your head. Let facts, not fear, figure into your decision making, especially during these trying times.
If I can be of help or if you need any additional information, please contact me directly. I’ll help how I can.
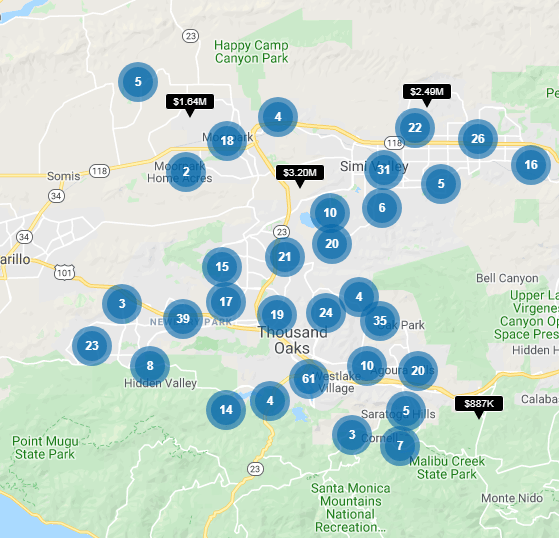
See all homes for sale in
Ventura County & the surrounding area
Disclaimer
Based on data obtained from CRMLS/CRISNet MLS (Southland Regional Association of Realtors) and Infosparks on 8/26/2020. San Fernando Valley and Santa Clarita Valley graphics from SRAR on 8/26/2020.
If your property is currently listed for sale, please disregard. It is not our intention to solicit the listings of other brokers.Display of MLS data is deemed reliable but is not guaranteed accurate by the MLS. The Realtor providing the information contained herein may or may not have been the Listing and/or Selling Agent.
Courtesy of Judy Burke | DRE#01883062 | eXp Realty


