Ventura County Home Sales for October 2019:
A Year to Year Comparison of September 2019 vs 2018 Sales
How were Ventura County home sales in September 2019? Have a look at the data below in the updated market report for October 2019.

This is the time of year when we start to have decreasing sales, and it lasts until January. These are the fall holiday months as well as back-to-school time. Let’s see what September 20199 brought us.
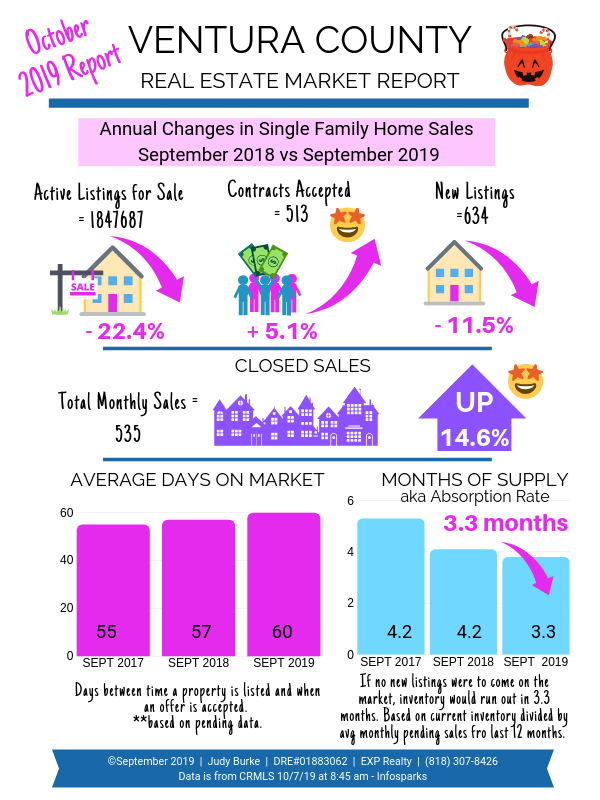
- Median home sales price: $660,000 compared to $675,000 in September 2018, a 2.2% decrease.
- Average home sales price: $799,782 compared to $827,007, a 3.5% decrease.
- New listings: 2019 had 634 vs 2018 had 716, And 11.3% decrease.
- Active listings: 1687 in 2019 compared to 2173 in 2018, representing a 22.4% decrease. Of note is that 2017 had 1942 active listings. Here are the year to year comparisons:
- 2017: 1942 active
- 2018: 2173 active (down 11.9% from 2017)
- 2019: 1687 active (down 22.4% from 2018). That’s a substantial drop. Although the figures went up in 2018, we’re now at a number that is much lower than the two previous years.
- Pending listings: 513 in 2019 vs 488 in 2018, a 5.1% increase.
Active listings in the context of this report represent all homes that in the process of being sold,. This category encompasses the MLS designations of Active, Active Under Contract, and Pending. In other words, they are at any stage of “for sale”, but not sold yet.
Ventura County Detailed Market Statistics: Zip Code Level
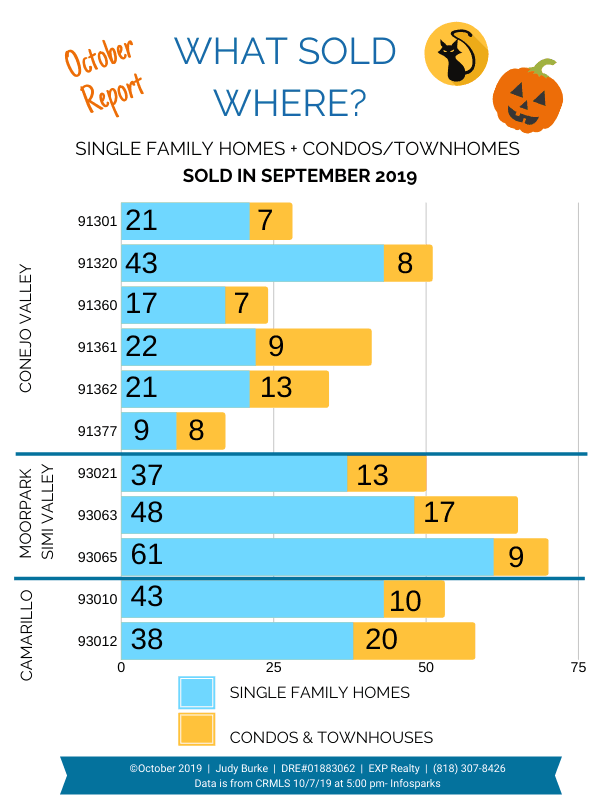
The pattern in Ventura County is mirrored in individual local ZIP Codes. It’s all about hyper-local. Below is a chart of single-family home, condo, and townhome sales in the predominant ZIP Codes of the Conejo Valley and nearby cities.

This month’s home sales leaders:
Simi Valley’s 93063 and 93065 and 91320 Newbury Park are consistently the front runners in number of sales.
Camarillo’s 93012 shows a high number of sales.
93021 Moorpark sales increased dramatically this month.
93021 Moorpark sales had been lower than other ZIP Codes for the preceding months, but September saw a surge in sales. There were 37 single-family homes and 13 condos and townhomes sold for a total of 50 homes sold in September 2019. The 37 homes sold represents an 85% increase to 2018‘s home sales of only 20 homes.
93065 Simi Valley also saw a dramatic increase in closed sales. There were 61 single-family homes sold in 2019, compared to 40 in 2018. That represents a 52.5% increase from the previous year.
91320 Newbury Park also had an increase, but not quite as dramatic. 2018 saw 33 single-family home sales compared with 43 in 2019. That represents a 30.3% increase year-over-year.
What Buyers Need to Know
Overall month’s supply decreased in September compared to the previous year. September 2019 shows a 3.3 month supply, down 21.4% from 2018’s 4.2 months supply. This decline in available choices should lead to increased competition for the limited supply of homes out there.
Buyers should be ready to act quickly in today’s limited choice market, especially with the anticipated decreasing supply of homes. This means that if you are eagerly awaiting the next listing to appear on the market, so is everyone else. Buyers who are diligently looking should be prepared to offer and not wait. If you see something that you like, move on it.
Just to give a broader perspective, a decline in the number of homes for sale at this time of year is not unusual. Historically the number of homes available for sale decreases between early fall and the end of the year, then resumes an upward trend with the new year.
What Sellers Need to Know
A decreasing supply of active listings means there is less competition if you are in the process of selling your home. It is still important to price it commensurate with its condition, location, and size. Being realistic is important in order not to have your house just sit on the market unsold. On the other hand, the months supply of 3.3 months, a decreased amount in Ventura County year-over-year is good news for sellers.
Wrap Up
Keep in mind that showing frequency slows with holidays and weather. As we approach Thanksgiving, activity slows to a crawl. It’s better to be proactive in October and zero in on a realistic price right up front. Otherwise a property could sit.
Tracking individual zip codes is far more informative than a county wide perspective. With the above graphic, you can see where most of the activity is.

Want a home in Moorpark with room for an office?
Disclaimer
Based on data obtained from CRMLS/CRISNet MLS (Southland Regional Association of Realtors) and Infosparks on 10/7/2019 at 8:45 am and 5:00 pm.
If your property is currently listed for sale, please disregard. It is not our intention to solicit the listings of other brokers.Display of MLS data is deemed reliable but is not guaranteed accurate by the MLS. The Realtor providing the information contained herein may or may not have been the Listing and/or Selling Agent.
Courtesy of Judy Burke | DRE#01883062 | eXp Realty of California, Inc.


