A Year to Year Comparison of December 2019 vs December 2018 Sales (the 4th Quarter)
Ventura County homes sales for October, November, and December 2019 were not typical. There is usually a slowing of the market during the last months of the year, but not this time. Sales we’re quick, time on market was down, and prices continued to rise. It was a busy 4th quarter.
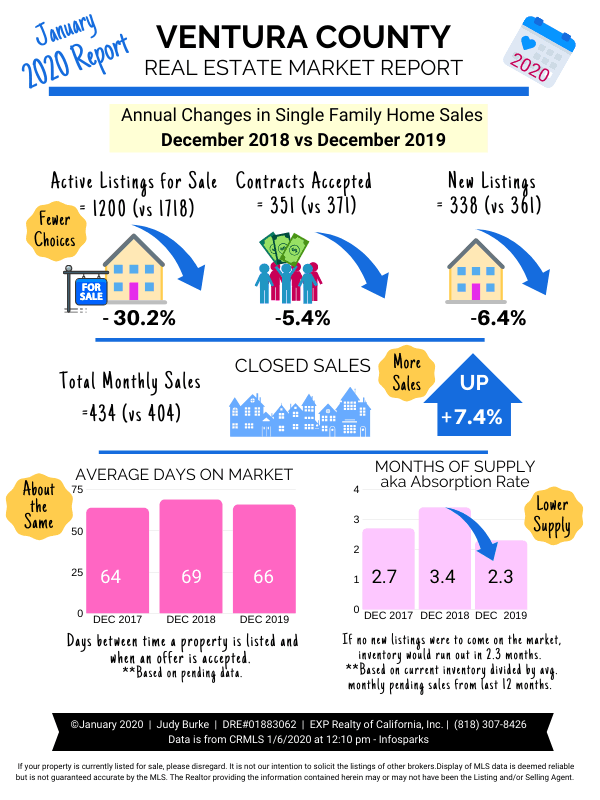
Real Estate Market Trends in Ventura County CA: December 2019
For December sales, it seemed that this month with holidays and vacation time would result in a slower market, but it was not to be. Instead we saw the best properties, especially those in move-in condition, go under contract within days of coming on the market, sometimes with multiple offers.
December was not a slow month.
Instead, demand was high, inventory was low, and homes in exemplary condition disappeared fast.
Market Statistics in Ventura County for December 2019
- Median home sales price: .The median home sales price: $667,750, up .8% from last year at this time. Not much of a change (less than 1%).
- Average single family home sales price: $852,408
- New listings: Newly listed single family homes also decreased, down 6.4% for a total of 338 new listings. November 2019 had 460 new listings, and December was even lower. This made it difficult for buyers. Not many choices.
- Active listings: Active listings were also down to 1200 single family homes, down 30.2% from 2019 at this time. This is a 500 home decrease in active listings. (Active pertains to anything for sale, including active, active under contract, and pending. In other words, people are trying to sell it, but it hasn’t closed yet.)
- Pending listings: Pending listings were also down to 351 for the month, down 5.4%. November 2019 had 425 pending listings, so again, there was a dramatic decrease in the number of pending homes from one month to the next. It is typical to have decreasing listing volume at this time of year.
Active listings in the context of this report represents all homes that are in the process of being sold. This category encompasses the MLS categories of Active, Active Under Contract, and Pending. In other words, they are at any stage of “for sale”, but have not sold yet.
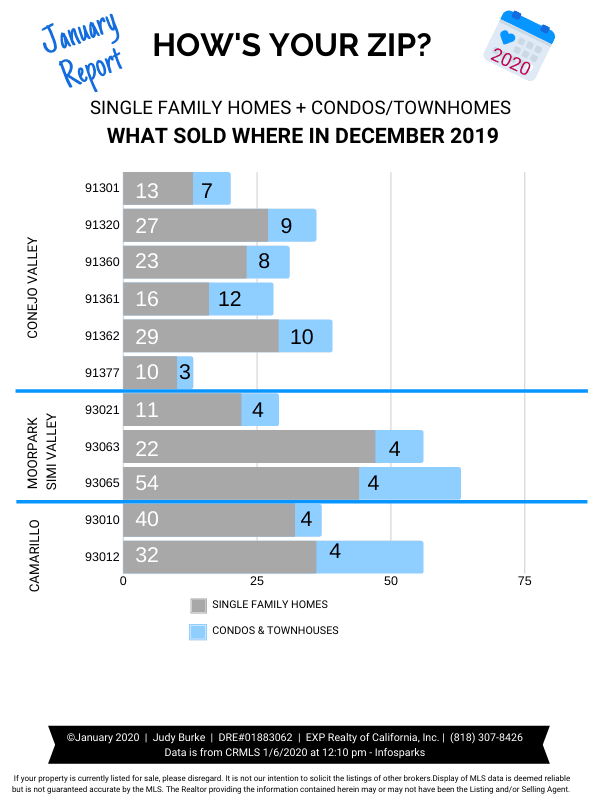
Ventura County Detailed Market Statistics: Zip Code Level
Below is a chart of single-family home, condo, and town home sales in the predominant ZIP Codes of the Conejo Valley and nearby cities.
This will let you see how specific zip codes compared to each other.
What Buyers Need to Know
Fewer Active Listings, Fewer New Listings, and Lower Months of Supply all mean that there were fewer house choices for sale. Hint: If you are a buyer and you like something, you need to quickly decide.
Just to give a broader perspective in where we are in the scheme of things, a decline in the number of homes for sale at this time of year is not unusual. Historically the number of homes available for sale decreases between early fall and the end of the year, then resumes an upward trend with the new year.
What Sellers Need to Know
A decreasing supply of active listings means less competition if you are in the process of selling your home. It is still important to price it commensurate with its condition, location, and size.
A Peek at the Nearby Valleys
Let’s face it. The Conejo Valley borders the San Fernando Valley, and the Santa Clarita Valley is just a quick drive north from there. It’s good to know what’s happening in adjacent areas, because they can tip us off whether we’re unique or if we’re a lesser version of what’s happening towards LA’s city center.
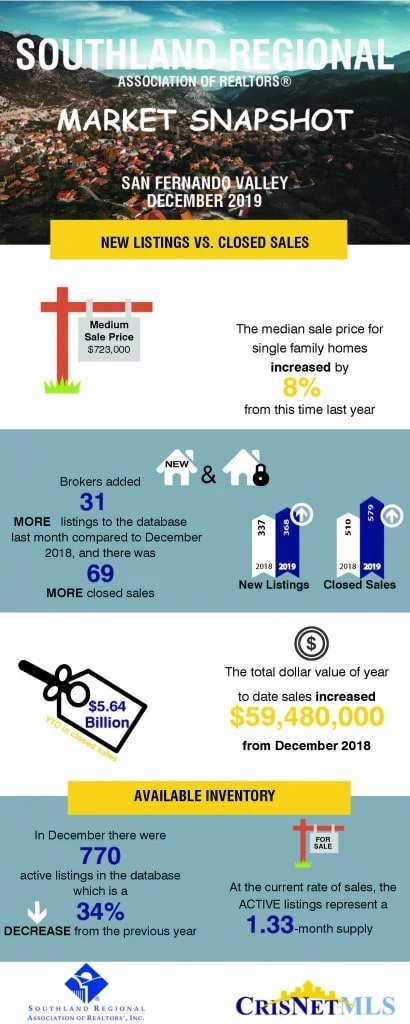
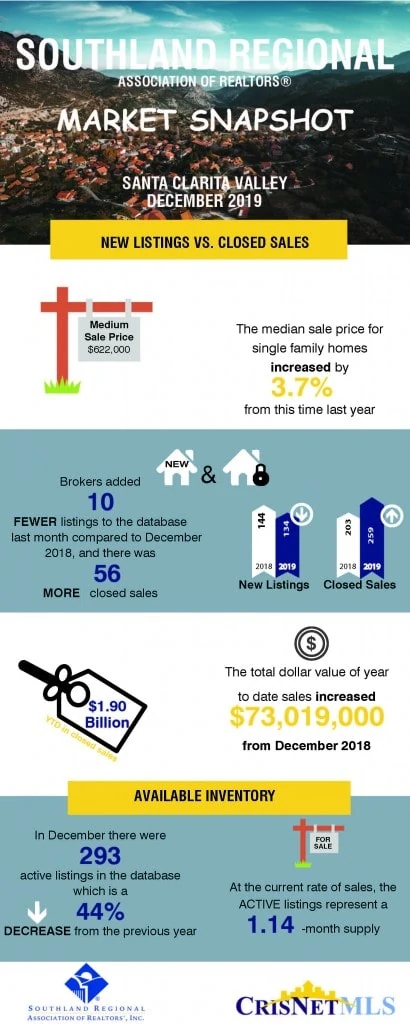
Here are stats for the nearby San Fernando Valley and Santa Clarita Valley. These are also for single family homes so that you can see how they compared.
It turns out that the Valley and particular parts of Los Angeles County have an even tighter inventory than we do. Ventura County. The graphics for the San Fernando Valley and Santa Clarita Valley show a Months of Supply under 2 months!
The San Fernando Valley
The Santa Clarita Valley
Wrap Up and My Two Cents
It was hard to find a house in December 2019. Really hard. Worse than last year and even worse than last month.
Look for the number of listings to begin a yearly spring increase starting in January. That will be welcome news for buyers.
And sellers, get ready. January is looking like the new March.
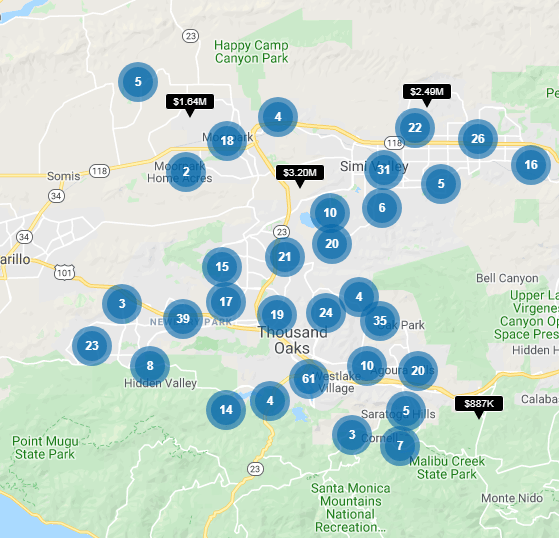
See all available homes
for sale in the
Greater Conejo Valley
Disclaimer
Based on data obtained from CRMLS/CRISNet MLS (Southland Regional Association of Realtors) and Infosparks on 1/6/2020 at 12:10 pm.
If your property is currently listed for sale, please disregard. It is not our intention to solicit the listings of other brokers.Display of MLS data is deemed reliable but is not guaranteed accurate by the MLS. The Realtor providing the information contained herein may or may not have been the Listing and/or Selling Agent.
Courtesy of Judy Burke | DRE#01883062 | eXp Realty of California, Inc.


