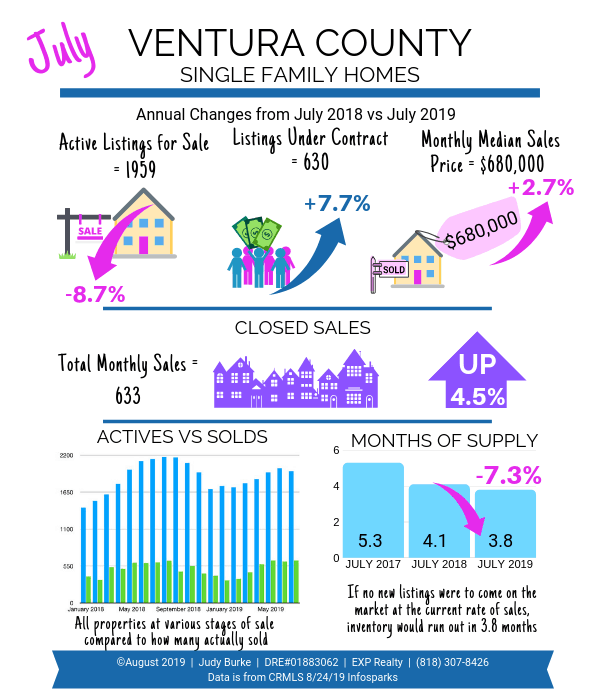
Data is in for Ventura County CA Home Sales for July 2019. The summer real estate market is drawing to a close and we’re entering the fall market. How did single family homes fare in Ventura County compared to July 2018, last year at this time?

Insight #1
“ACTIVE” can have more than one meaning
“Active” is not self-explanatory, and the meaning can be confusing. It can mean, depending on the context:
- EITHER All the houses currently available on the MLS that don’t have an offer yet,
- OR Everything that had a for sale sign in the past month, but didn’t sell yet (Someone was trying to sell it). This includes the MLS categories of Active, Active Under Contract, and Pending.
In the above infographic, “Active” refers to the 2nd definition. It was “for sale” and someone was trying to sell it. That’s how we’ll look at it here in this context. This can be at any stage of sale, just not sold yet. It could be new that month, stuck in limbo for the past several months with someone trying every which way to get it sold, or under contract or pending (in escrow).
Again, it just hasn’t sold. At least not yet.
Insight #2
The significance of “Listings Under Contract”
This category encompasses “Active Under Contract” where the buyer has written an offer, it was accepted, and it is now in escrow, subject to various contingencies. “Pending” is typically reserved for when all the contingencies have been removed.
So this category is for every home that is in some stage of escrow. The important thing to note is that these houses GOT OFFERS.
Insight #3
“Closed Sales” is the most important category of them all
These homes actually closed escrow or SOLD. This is the real test of the market, and it’s the most significant piece of data. Anybody can put out a for sale sign and try to sell their house. Only some get offers. And fewer still are successful getting to the finish line. Those are the ones that matter, the ones that achieved their goal.
Insight #4
“Actives” vs “Solds” ratio
This is comparing “Active” (Active, Active Under Contract, and Pending) vs “Closed Sales” (Sold). This gives you a chance to see if how the market is absorbing homes. Are home sales flat while Active inventory is building? Are they tracking with each other or diverging? You’ll want to keep an eye on how they compare to each other. You’ll also want to look to see seasonal patterns of increase and decrease.
Insight #5
“Months of Supply” (aka Absorption Rate) shows market heat
This is significant and is a corollary of the Actives vs Sold. It refers directly to the housing supply, specifically answering the question “If no new houses came onto the market, at the current rate of sales, how many months would it take to sell them all?”
What It Means
July 2019: What this month’s report means for SELLERS
Look for decreasing sales and decreasing new listings as we head toward the end of the year. As inventory decreases, there will be fewer choices for buyers. If you have a house that has been difficult to sell, your likelihood of selling may increase, as long as it is correctly priced. This is a time of year favoring sellers. There is less competition is a good thing.
What It Means
July 2019: What this month’s report means for BUYERS
With fewer choices in the months to come, buyers will want to be ready to pounce if a good one comes along. Know your prices. Fewer choices can be frustrating to deal with, when the new supply slows to a trickly. Hang in there, It only takes one good one to make you a homeowner. There will also likely be less competition for you as a buyer, especially as families with children settle into the new school year in late August.
Disclaimer
Based on data obtained from CRMLS/CRISNet MLS (Southland Regional Association of Realtors) and Infosparks on 8/24/2019.
If your property is currently listed for sale, please disregard. It is not our intention to solicit the listings of other brokers.Display of MLS data is deemed reliable but is not guaranteed accurate by the MLS. The Realtor providing the information contained herein may or may not have been the Listing and/or Selling Agent.
Courtesy of Judy Burke | DRE#01883062 | eXp Realty of California, Inc.


