Ventura County CA Housing Market Update – October 2024
We’re starting into the Fall market. In this home sales report I’ll include lots of stats and visuals of the activity of last month, September.
As a reminder, we always look back one month.
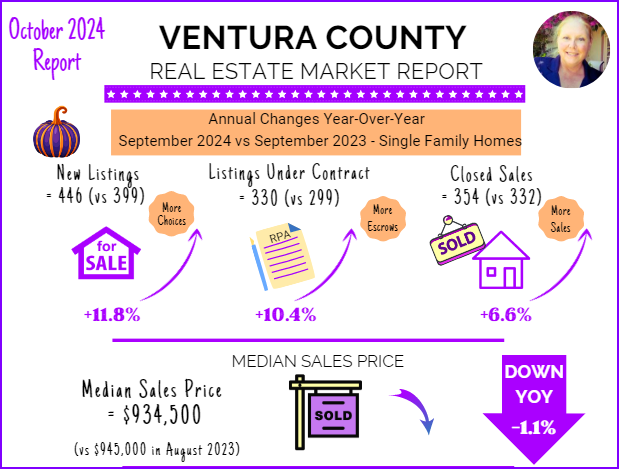
The Supply and the Price
With more new listings (more supply), it follows that there were more homes entering into escrow (Listings Under Contract), resulting in more closed sales.
The graphic shows that this year did better than last year for September single family home sales) if you look at the actual inventory performance. All up arrows (increases) straight across.
The median sales price was down a little, year over year.
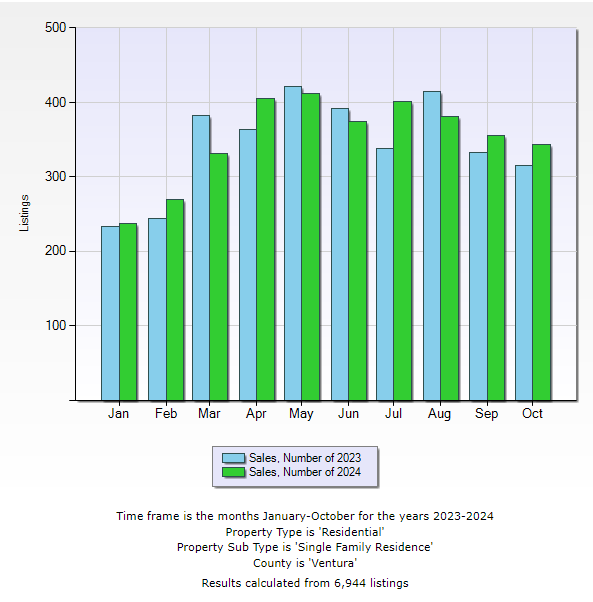
A Closer Look at Number of Home Sales Last Year vs This Year
The comparison between last year was a mixed bag. The majority of months showed higher numbers for 2024 compared to 2023.
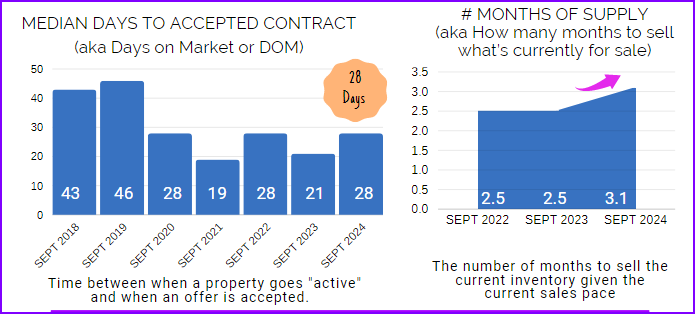
Time: Days on Market and Months of Supply
Median Days to Contract (DOM) is up compared to last year.
As a reminder, Days on Market refers to the time from entering Active status until an offer is accepted. It does not include Coming Soon days.
Number of Months Supply for September 2024 increased to 3.1 months.
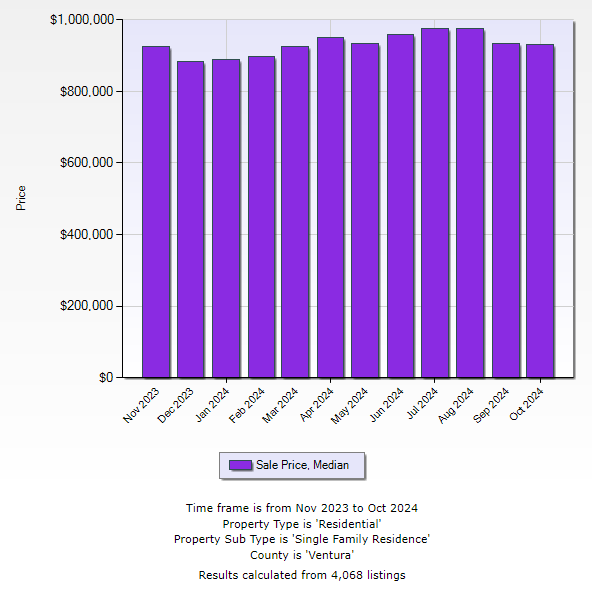
Median Sales Price
Graphs give a fast picture.
I don’t see prices screaming up in the chart below.
In fact, it looks fairly level.
We had a brief interest rate down-tick, but no surge in price, at least in the chart.
Interest rates continue to have an effect on affordability and price.
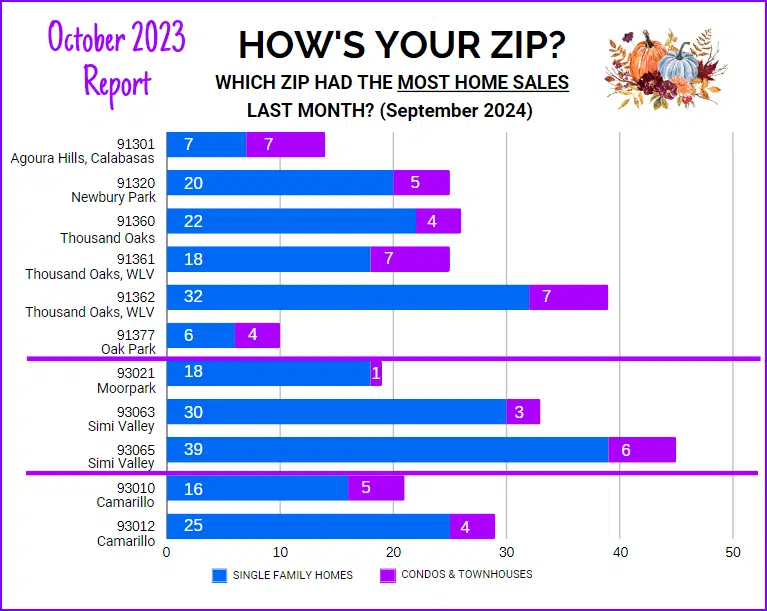
How’s Your Zip?
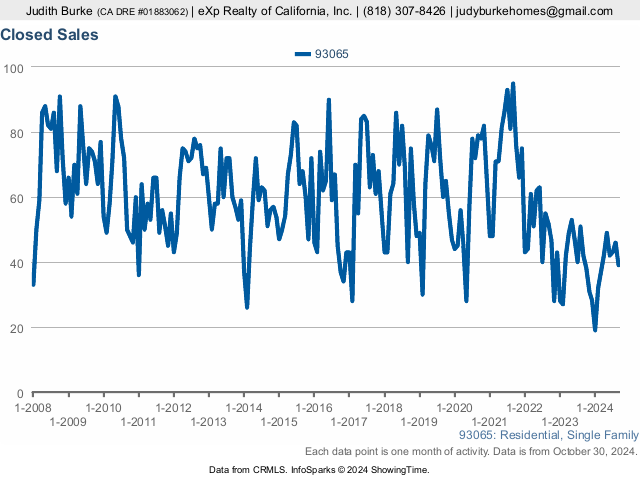
Simi Valley 93065: Historical Home Sales
The highest number of sales for the month was in Simi Valley’s 93065.
Although this exceeded surrounding cities, I can remember months of 60 plus, and even months above 90.
In fact, in September 2021 there were 95 single family home sales! That’s a far cry from 39.
If you click on the chart below, it opens a pop-up window and you can see exact pinpointed values on an interactive chart.
Seeing the months side by side gives a much clearer picture than the one year lookback.
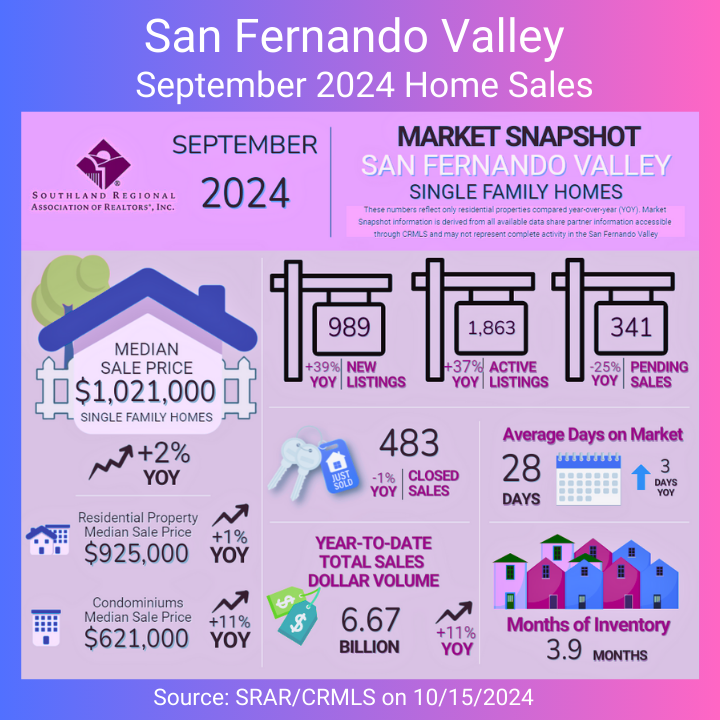
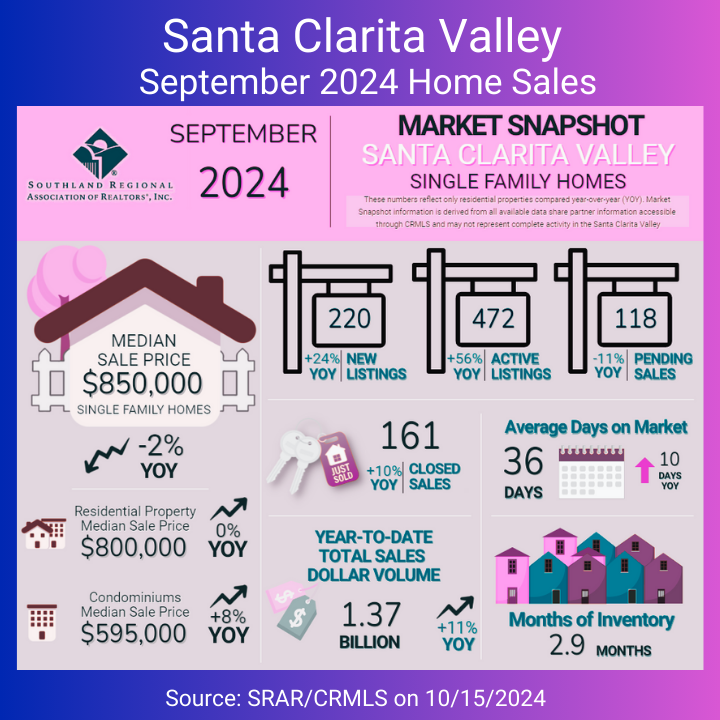
In the Nearby San Fernando Valley and Santa Clarita Valley
Here are 2 local nearby valleys.
All of California
The Market At A Glance report below is from the California Association of Realtors.
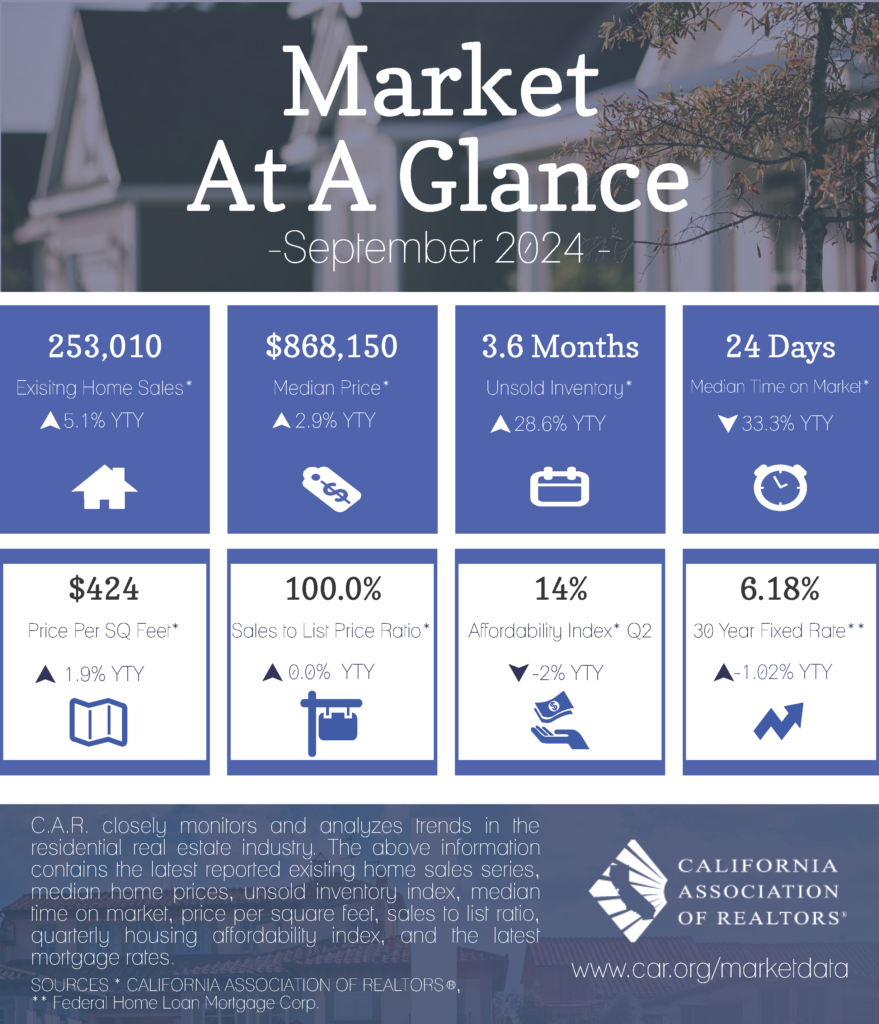
Last month I wrote about the affordability problem in our state. It’s worth posting a link to the report again. California Housing Affordability Update.
Wrap Up
Watch the data. Numbers tell the truth.
Interest rates are changing. If you’re a buyer, stay in contact with your lender.
Whether you’re a buyer or a seller, there have been changes as a result of the NAR settlement. It’s a work in progress, not finalized yet. These things take time.
Be sure to consult with your realtor to keep abreast of ongoing changes.
I can be of help or if you need any additional information, just let me know.
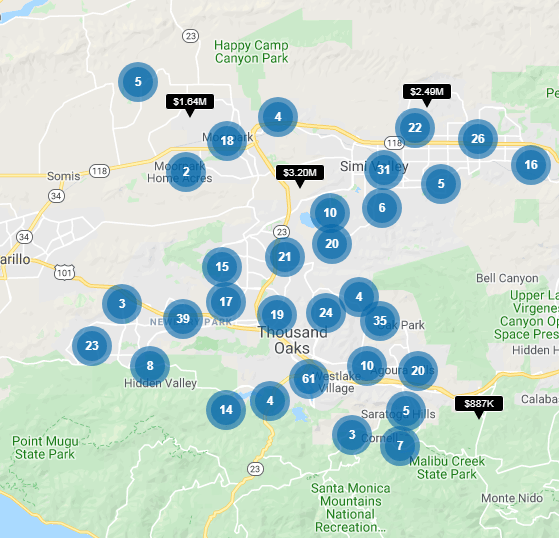
Want to see which homes are for sale right now
in Ventura County?
Want to see which homes are for sale right now
in Ventura County?
Disclaimer
Based on data obtained from CRMLS/CRISNet MLS (Southland Regional Association of REALTOR®) and InfoSparks on 10/10/2024, 10/24/2024, 10/30/2024. Also SRAR’s MLS on 10/15/2024 as noted for the 2 valleys.
If your property is currently listed for sale, please disregard. It is not our intention to solicit the listings of other brokers. Display of MLS data is deemed reliable but is not guaranteed accurate by the MLS. The REALTOR® providing the information contained herein may or may not have been the Listing and/or Selling Agent.
Courtesy of Judy Burke | DRE#01883062 | eXp Realty
