Ventura County Housing Market Update – March 2023
Here’s where to see the last two March reports. MARCH 2022 REPORT. And last year is here. MARCH 2021.
Home sales by month are down in our local market.
It began to change last January, and was in full force by April 2022.
And this extends nationally, statewide, and across the broader Southern California region.
Low supply and low interest rates vs low supply and higher interest rates is the current name of the game.
Can you say “shock to the pocketbook?” That’s what happens when interest rated double in the course of one year.
It’s what buyers are currently experiencing. And sellers moving to a different house using new financing.
Ouch time.
Cash buyers aren’t feeling the same pinch because they’re interest rate independent.
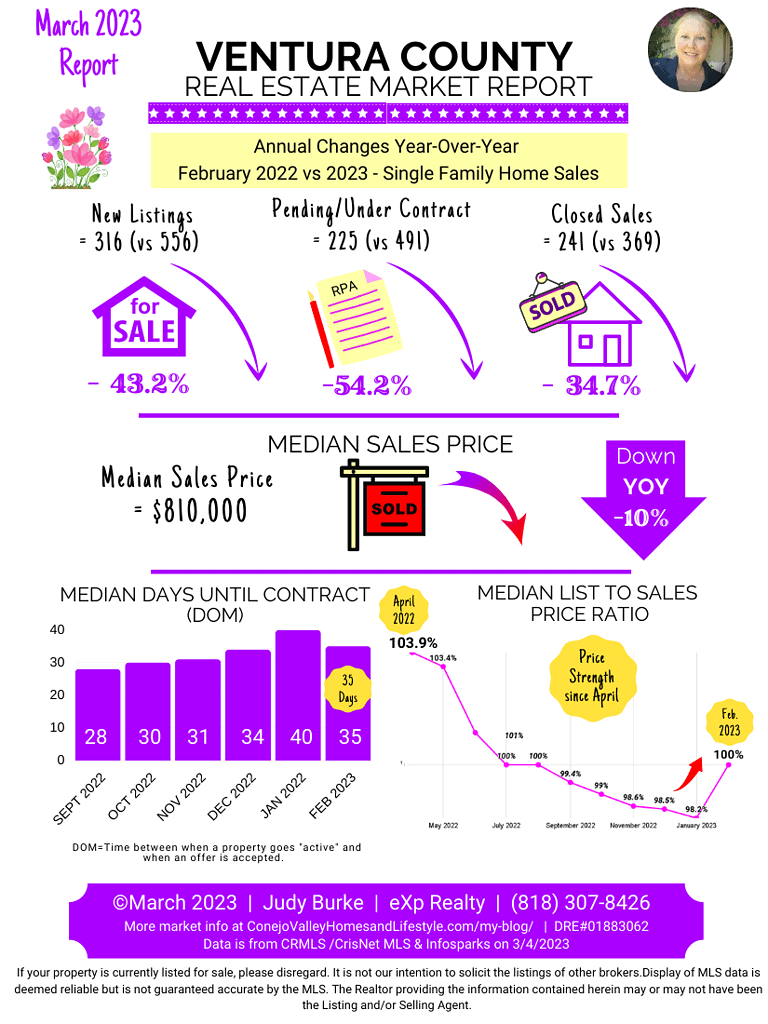
Here’s what the supply looks like year-over-year.
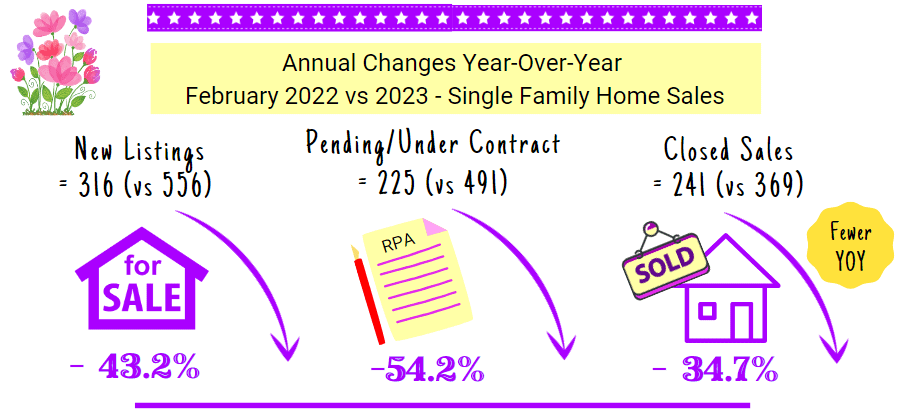
That’s a decrease in every category. But it makes sense. New listings are the starting point of activity.
Interest rates have doubled, and the housing market is definitely feeling the consequence.
- The April Big Picture Bird’s Eye View: Home Sales Year-Over-Year
- Closed Sales: Big Boing Up From February
- Days on Market: Less than 2 Weeks Again
- New Listings: Fewer than Last Year
- Median Sales Price: No Break in the Upward Trend
- The San Fernando Valley
- What Buyers Need to Know
- What Sellers Need to Know
- Wrap Up
The Big Picture in Ventura County for March?
We have to look back one month to February to get our numbers.
Because I’m a visual person, I like to view it as a graphic.
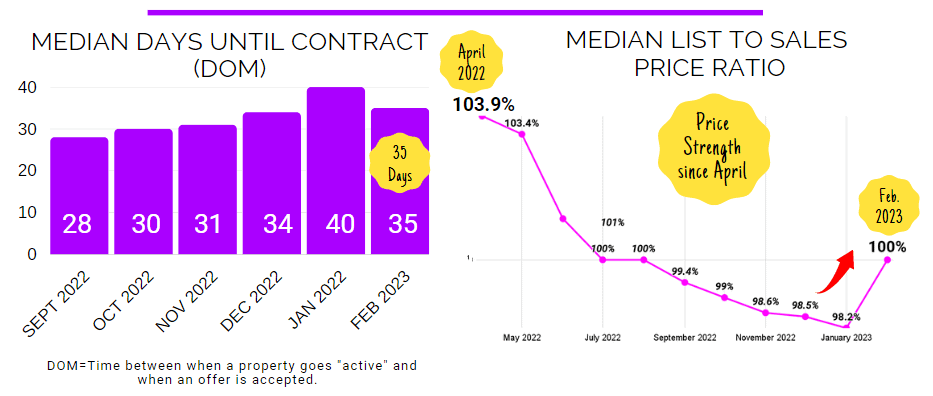
There are two big things to be aware of right now: Days on Market (DOM) and Median List to Sales Price Ratio.
Days on Market have increased, and then dropped down a bit in February. These are NOT long days on market historically. We’ve just come out of a buying and selling frenzy during the past 2 years.
The median list to sales price ratio had been decreasing since April 2022, but it popped up again last month. Buyers are out again.
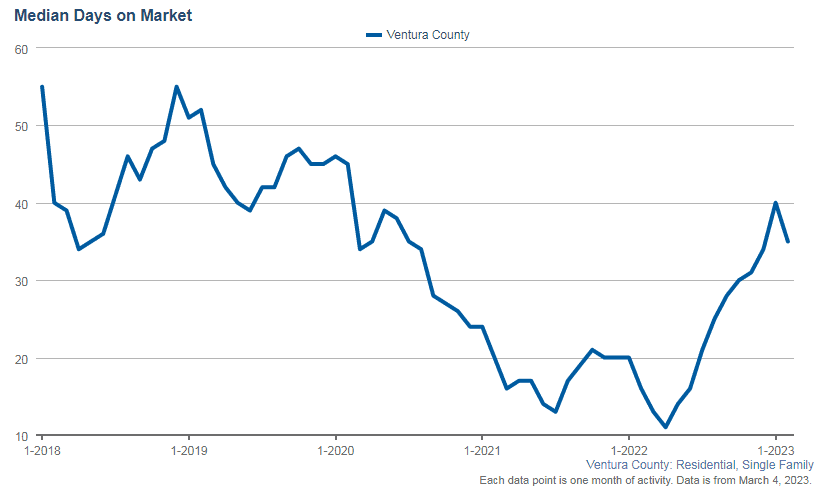
What I love about the chart below that shows the market for the last 5 years is how clearly you can see the plunge in Days on Market (DOM) in 2020. Prior to that it ranged between 35 and 55 days.
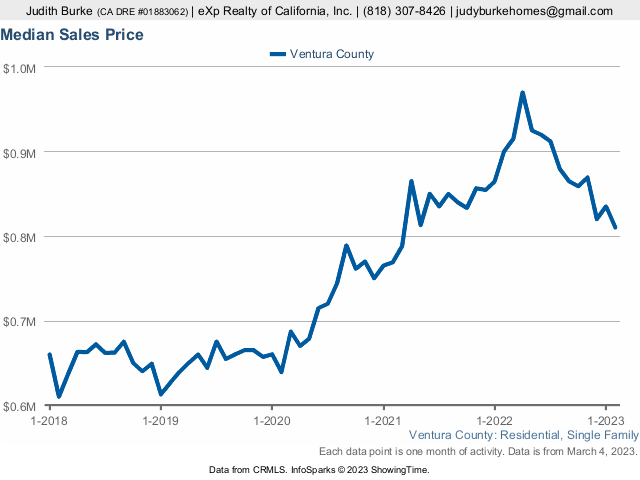
Here’s another interesting chart on Median Sales Price. See how it took off in 2020?
The Catalysts
Supply is the fuel. New Listings, Pending/Under Contracts, and Closed Sales are at the heart of it.
How’s Your Zip? A Local Perspective
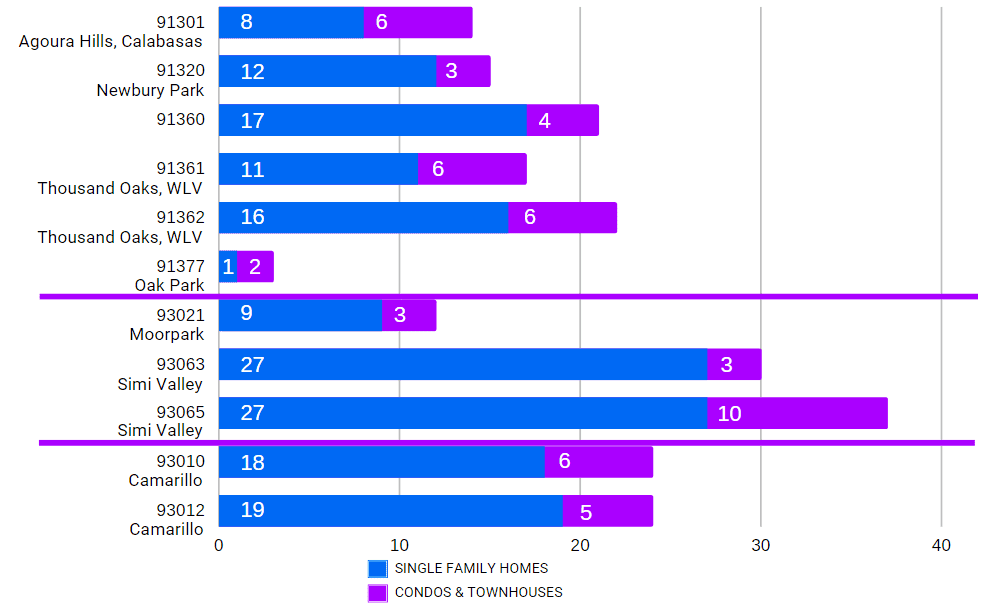
What I Love about the zip code chart is that you can see the areas of greatest activity.
Over all, sales were down for single family homes, condos, and townhouses. Some of this is seasonal, the lull just before spring. Plus we’ve had record rain and people stay inside more.
With “new listings” down, it follows that total monthly sales also are down. It’s a supply issue. Buyers are still out there, but the supply is still low. Few choices.
As usual, Simi Valley outpaced all the other zip codes in February 2023 home sales.
In the Nearby San Fernando Valley
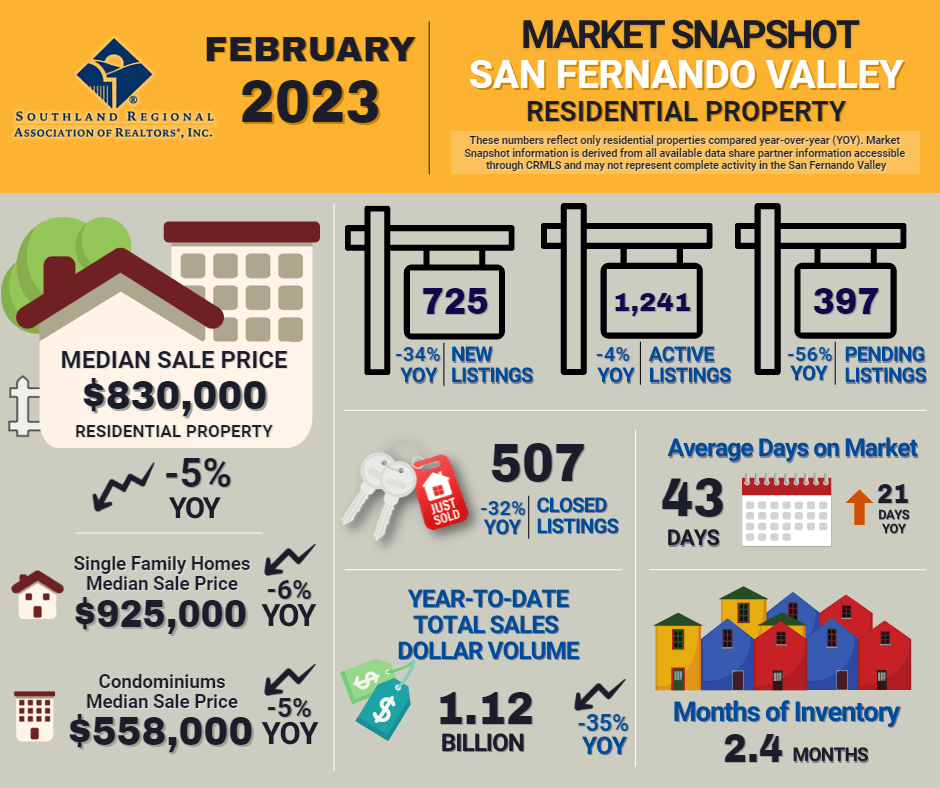
The San Fernando Valley is a huge market and reflects a similar picture to what’s happening in the nearby Conejo Valley and Simi Valley.
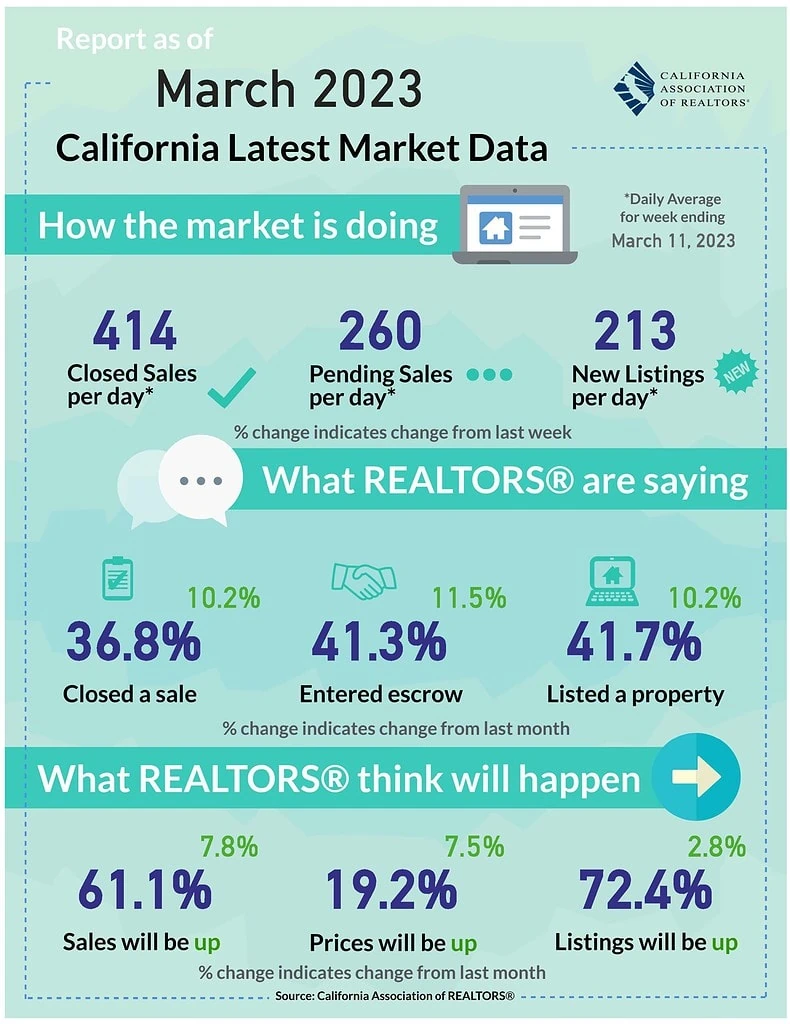
Looking at the Entire State of California
It’s also good to take a look at things on the state level.
This is from the California Association of REALTORS®. It has a different focus. Not so much pure numbers, but rather what agents say or anticipate.
What Buyers Need to Know
The good news for buyers is that prices aren’t screaming up like they were in 2020 and 2021.
Interest rates are changing constantly. Stay in touch with your lender. Even a slight change can affect what you can afford.
Also, talk to your REALTOR® about interest rate buy downs.
What Sellers Need to Know
Familiarize yourself with the concept of a buy-down for the buyer.
Prep your home to show it in the best possible condition. Buyers are scrutinizing more.
MAKE YOUR HOME SPARKLE.
TALK TO your REALTOR® before any improvements as you prep for the sale.. Some repairs pay off; others don’t. Spend wisely and strategically.
BRAINSTORM with your REALTOR® about strategies as the market continues to change.
Wrap Up
Now more than ever is the time to stay current on what’s happening, and to follow the most recent data.
The market is always changing, always. Don’t be blindsided. WATCH THE DATA.
I can be of help or if you need any additional information, just let me know.
Want to see which homes are for sale right now
in Ventura County?
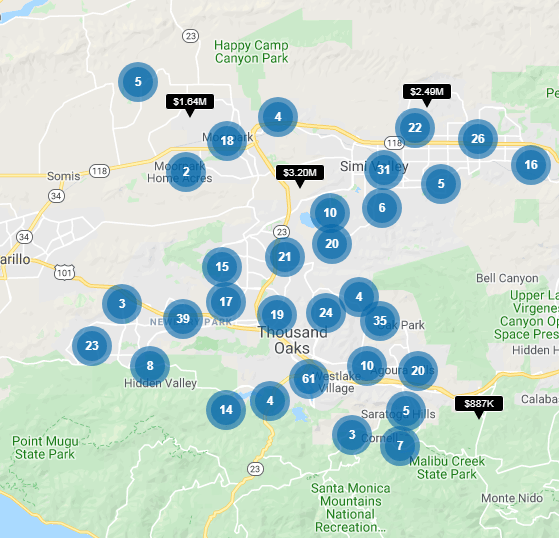
Want to see which homes are for sale right now
in Ventura County?
Disclaimer
Based on data obtained from CRMLS/CRISNet MLS (Southland Regional Association of REALTOR®) and InfoSparks on 3/4/2023.
If your property is currently listed for sale, please disregard. It is not our intention to solicit the listings of other brokers. Display of MLS data is deemed reliable but is not guaranteed accurate by the MLS. The REALTOR® providing the information contained herein may or may not have been the Listing and/or Selling Agent.
Courtesy of Judy Burke | DRE#01883062 | eXp Realty


